Blog Customer FeedbackTop 9 NPS Alternatives to Measure Customer Experience
Top 9 NPS Alternatives to Measure Customer Experience
NPS only tells you part of the story. Here are 9 NPS alternatives (CSAT, CES, Customer Health Score, NPS 3.0 and more) that actually capture customer experience.


✨ Start measuring NPS with Featurebase's in-app surveys for free →
NPS or Net Promoter Score is one of the most widely used methods for measuring customer experience. It's easy to do, quick, and there are tons of data points to help you compare your NPS score against others in your industry.
However, NPS is not the only method for measuring customer sentiment and expectations. If you want more detailed, actionable feedback, you should probably consider some NPS alternatives.
These are the best of the best. 👇
Key takeaways
- Customer Satisfaction Score (CSAT) - Quick way to ask how satisfied customers are on a 1-5 scale. Use it for instant feedback right after a touchpoint.
- Customer Effort Score (CES) - Measures the effort needed to interact with a product or service. Best for spotting customer journey friction.
- Voice of Customer (VoC) - Gathers feedback across surveys, support chats, and interviews. Gives a full picture of customer thoughts.
- Product Engagement Score (PES) - A single number showing how deeply customers interact with your product. Best for tracking usage patterns in SaaS.
- Customer Churn Rate (CCR) - Shows the rate at which customers leave. Pairs naturally with a churn survey to understand why they left.
- Customer Retention Rate (CRR) - Measures how many customers stay over time. The flip side of churn, it signals customer loyalty.
- Customer Lifetime Value (CLV) - Estimates total revenue a customer will generate. Helps you budget for acquisition and retention.
- Customer Health Score (CHS) - Composite metric that combines usage, support, and satisfaction signals to predict renewal or churn.
- NPS 3.0 / Earned Growth Rate - Reichheld's 2021 follow-up that ties promoter behavior to actual revenue from repeat customers and referrals.
What is Net Promoter Score (NPS)?
Net Promoter Score (NPS) is a customer loyalty metric that measures how likely customers are to recommend a company's products or services to others.
It was introduced by Fred Reichheld in a 2003 Harvard Business Review article as "the one number you need to grow". In Reichheld's original research, the recommendation question was tested across 8 candidate survey questions and 4,000 consumers, and it ended up as the #1 or #2 strongest predictor of repeat purchases and referrals in 11 of 14 case studies.
An NPS survey asks customers a single question:
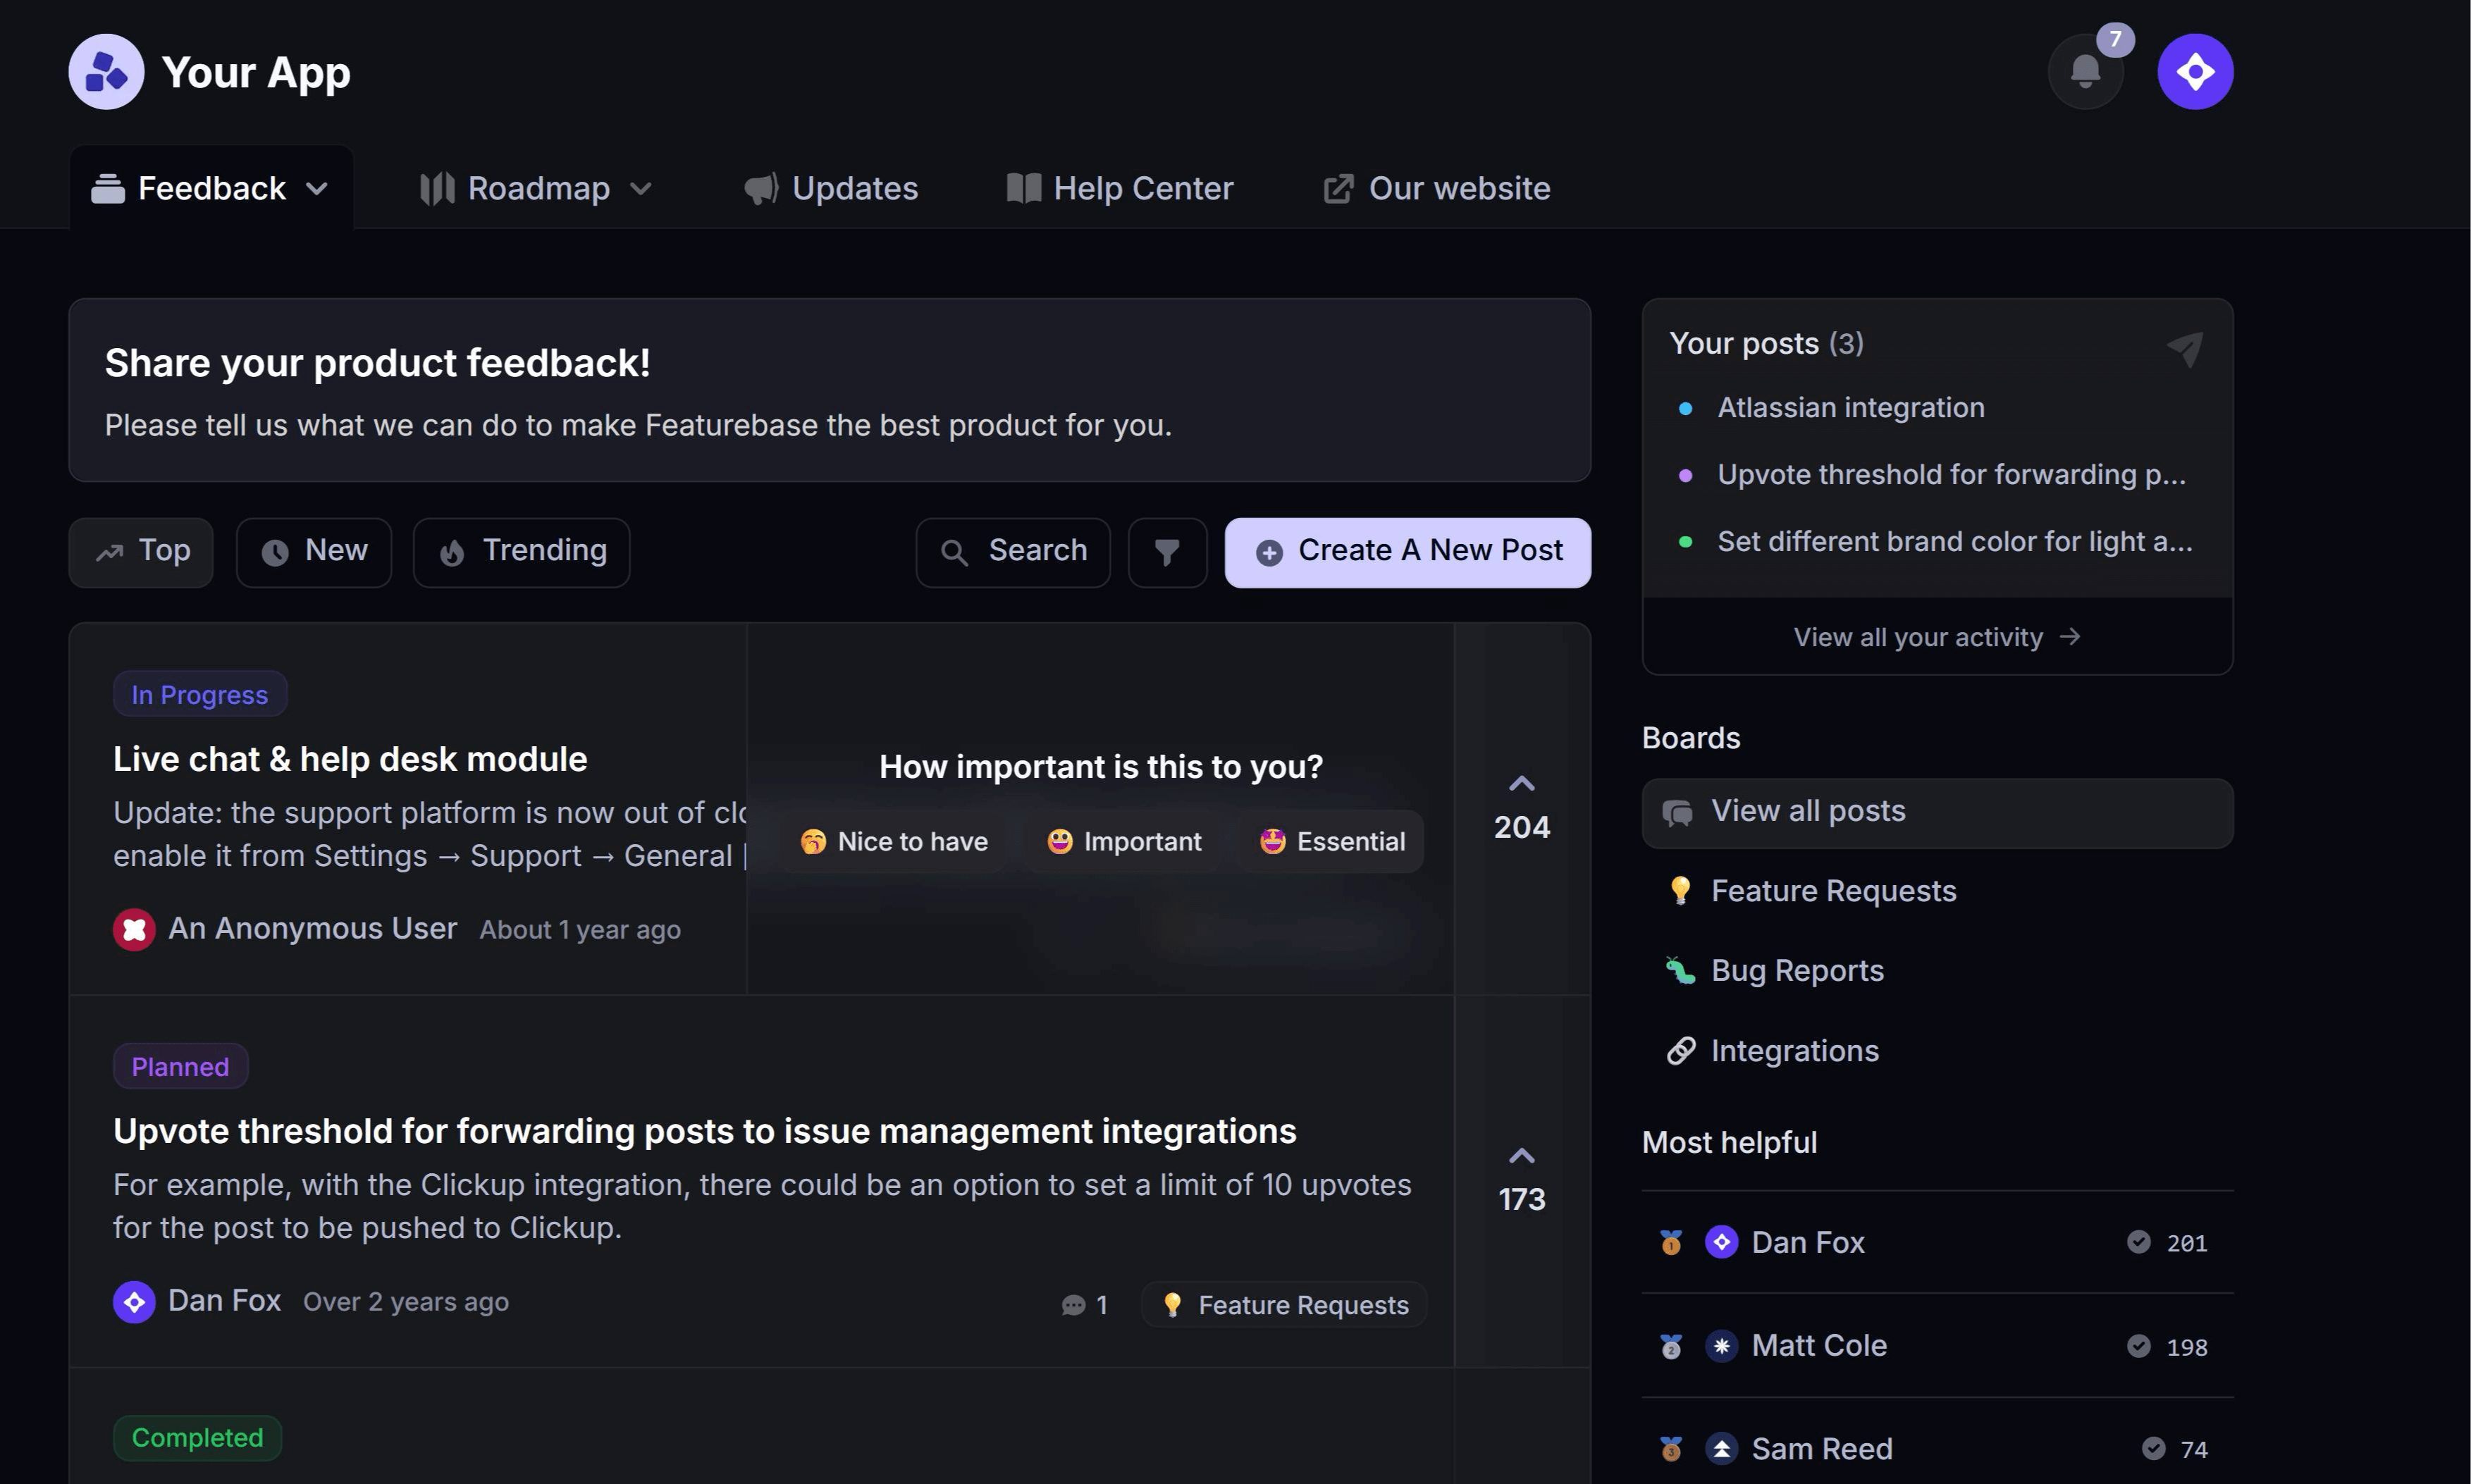
"On a scale from 0 to 10, how likely are you to recommend our company/product/service to a friend or colleague?"
Respondents are categorized into three groups:
- Promoters (9-10)
- Passives (7-8)
- Detractors (0-6)
The NPS is the percentage of Promoters minus the percentage of Detractors, giving a score from -100 to +100. The higher, the better.
NPS = (Percentage of Promoters) - (Percentage of Detractors)

Start running surveys & collecting feedback
Create targeted NPS, CSAT, multiple-choice, or text response surveys for free
The limitations of the NPS Score
NPS is still widely used, but its dominance has been softening, and fast.
In a 2025 Digital CX Priorities survey from TELUS Digital and Statista, only 23% of US enterprise CX leaders said they were using NPS to measure performance (as of May 2026). The rest have moved to multi-metric stacks that combine NPS with CSAT, CES, customer health scores, and behavioral data.
Despite its widespread use, NPS has limitations that all businesses should consider to avoid making decisions based on insufficient information.
- Too general
An NPS score simply reveals whether customers are likely to recommend you or not. It leaves you guessing about the reasons behind their willingness to refer your brand to others. To uncover these vital insights, you'll need to conduct additional surveys and questionnaires, diving deeper into the specifics of areas for improvement. - Ignores customer importance
NPS treats all customer responses equally and doesn't account for the different levels of importance of each customer. Not all user feedback carries the same weight in terms of business impact. The opinion of a high-spending, long-term customer might be more valuable for your strategy than that of a one-time purchaser, but NPS doesn't distinguish between the two. Unfortunately, not all customer happiness is equal. - Affected by recent experiences
If a customer has just had a particularly good or bad interaction, their score might reflect their immediate reaction rather than their overall opinion of your product. NPS can't accurately track customers' consistent long-term views, which you need to understand their satisfaction. - Doesn't provide actionable insights
Lastly, NPS itself doesn't actually provide any clear directions for improvement. While it can alert you to potential problems (if your score is lower than expected), it doesn't specify what aspects of your product or service need enhancement. This lack of actionable feedback makes it challenging to implement specific changes that could directly boost customer satisfaction and loyalty.
Overall, you should combine NPS with other customer success metrics to gain a deeper understanding of customer experience.
The 9 Best Alternatives to Net Promoter Score
Now that you know the downsides of NPS and why you should use it together with other metrics, let's take a look at them. 👇
Here are nine of the most powerful and popular customer satisfaction KPIs you should combine with NPS.
1. Customer Satisfaction Score (CSAT)
The Customer Satisfaction Score (CSAT) is a straightforward measure that asks customers to rate their satisfaction with your service or product.
Usually, you measure customer satisfaction levels with just one simple question, such as "How satisfied were you with your experience?"
When measuring customer satisfaction, responses range from 1 (very unsatisfied) to 5 (very satisfied).
To calculate your total CSAT score, divide the number of respondents who selected 4 and 5 by the total number of respondents. You can use the total sum to equally benchmark results over time.
CSAT = number of positive answers (4 & 5) / total respondents
CSAT is effective because it captures immediate (transactional) feedback following an interaction or purchase.
It's perfect for combining with NPS - instead of showing how likely customers are to recommend you, it reveals their feelings about a specific process or part of your product. In other words, you combine customer sentiment and tangible, quantitative feedback.
2. Customer Effort Score (CES)
The Customer Effort Score (CES) measures the effort your customers have to put in to interact with a specific part of your product or service. In other words, how much effort someone has to put into any action.
This could be either buying a product, getting extra seats for their account, or accessing billing information.
A typical question for customer effort score would be "How easy was it to handle your issue?" with responses ranging from 1 (very easy) to 5.
To calculate the total CES, divide the sum of scores by the total number of responses. So, if your total score is 300 and you received 50 responses, the total CES is 6.
CES = total sum of scores / number of survey responses
Use CES together with NPS to understand the friction points in the customer journey.
3. Voice of Customer (VoC)
Voice of Customer (VoC) means listening to what your customers say across different platforms. It gathers everything from survey answers and support chats to social media comments, helping you gauge customer expectations and collect various customer data.
This approach gives you a full picture of your customers' thoughts and feelings about your product or service.
VoC surveys can be both quantitative and qualitative:
- Quantitative questions are easily calculable (on a 1-5 scale) and may be as simple as, "Did our product meet your expectations?" or "How likely are you to use our service again?" The feedback is easy to run through Excel and other spreadsheets.
- Qualitative (open-ended) questions can, in turn, give much insight into the "why?" behind customer feelings and decisions. Examples could be, "What did you like most about our product?" or "How can we improve your experience?"
A strong VoC program doesn't stop at surveys, though. The single highest-signal addition is customer interviews: 20-30 minute conversations with a small sample of customers where you dig into how they actually use your product, what alternatives they considered, and where the experience breaks down. Teams that want to formalize this typically run a customer advisory board with a rotating set of power users.
Interviews surface insight that no survey will. They're slower and harder to scale, but every other metric on this list looks better when it's calibrated against what you hear in the interviews. Pair one interview per week with your quantitative VoC pipeline and you'll consistently understand not just what customers do, but why.
4. Product Engagement Score (PES)
The Product Engagement Score (PES) is a single number that shows how involved your customers are with your product. Tracking how often and how deeply people use your product is highly relevant, especially for SaaS.
For instance, it might track how many features they use, how often they log in, or how much time they spend with the product.
PES is great because it shows you not just IF customers are using your product, but HOW they're using it.
This can help you understand which features are hitting the mark and which ones might need a rethink. By keeping an eye on PES, you can spot trends, figure out what keeps people coming back, and make your product even better.
5. Customer Churn Rate (CCR)
Customer Churn Rate (CCR) is the rate at which customers cancel their subscriptions or stop using your service over a specific period. It's one of the key metrics for understanding customer retention and loyalty, especially for SaaS businesses that rely on subscription models and recurring revenue.
To calculate the churn rate, you divide the number of customers lost (churned) during the period by the total number of customers at the start of the period, then multiply by 100 to get a percentage. Many finance tracking tools, like Stripe or ChartMogul, do this automatically.
CCR = (Customers beginning of period - customers end of period) / customer beginning of period
In SaaS, a low churn rate is critical for long-term success and product-led growth. High churn indicates issues with customer satisfaction, product-market fit, or the effectiveness of ongoing support.
CCR tells you how many customers leave but not why. That's where a churn survey comes in. A churn survey is a short questionnaire shown to customers right at the moment they cancel, asking what drove the decision. Typical questions include:
- What's the main reason you're canceling today?
- Which alternative are you switching to (if any)?
- What could we have done to keep you?
Pairing CCR with a churn survey is the highest-leverage combination on this list. The rate tells you the size of the problem. The survey tells you which fix would actually move it.
6. Customer Retention Rate (CRR)
Customer Retention Rate (CRR) measures the percentage of customers who stay with your company over a specific time period. It's essentially the opposite of the churn rate, focusing on the positive aspect of customer loyalty.
To calculate CRR, subtract the number of new customers acquired during the period from the total number of customers at the end of the period, then divide by the total number of customers at the start of the period and multiply by 100.
CRR = (ending customers - new customers) / beginning customers
CRR is a key metric for businesses like SaaS, where long-term relationships and recurring revenue are essential. A high retention rate signals strong customer satisfaction and loyalty, indicating that your product continues to meet and exceed customer needs over time.
For example, it could mean that your customer service representatives are doing a great job at helping customers in need, effectively lowering customer churn.
7. Customer Lifetime Value (CLV)
Customer Lifetime Value (CLV) is an estimate of the total value you can expect from a single customer throughout their relationship with your company and the entire purchasing process.
This metric combines the average purchase value and customer lifespan to estimate the total revenue a customer will generate for you.
We suggest hooking up a finance tracking tool to see this metric automatically. You can also estimate it using this formula:
CLV = (Customer Value * Average Customer Lifespan)
A higher CLV suggests that your company is successful in maintaining long-lasting customer relationships, which is beneficial as acquiring new customers is costly.
It's one of the key metrics for SaaS because knowing the potential total value of customers tells you a lot. It can help you estimate how much you can invest in acquiring new customers and retaining existing ones. Keeping an eye on the historical trend of CLV can also give you a clue about the general customer satisfaction level.
8. Customer Health Score (CHS)
The Customer Health Score (CHS) is a composite metric, usually expressed as a number from 0 to 100, that predicts whether a customer is on track to renew, expand, or churn. It originated in the B2B SaaS customer success movement and is the metric Forrester explicitly names as a credible NPS replacement for software companies.
What makes CHS powerful is that it doesn't rely on a single signal. It combines several inputs into one score:
- Product usage - login frequency, feature adoption, depth of use
- Support history - number of tickets, response satisfaction, unresolved issues
- Satisfaction signals - recent CSAT or NPS responses
- Commercial signals - payment health, expansion vs. contraction, plan tier
- Engagement - email opens, in-app message responses, attendance at customer events
Most teams bucket the resulting score into health tiers: 80-100 = healthy, 60-79 = monitor, below 40 = at risk. A drop of 30% month-over-month in feature engagement is one of the most common early-warning signals.
The big advantage over NPS: CHS surfaces at-risk accounts weeks before they would actually churn, giving customer success teams time to intervene. The downside is that it's much harder to set up than a single survey question, since it requires real instrumentation of product data, support data, and billing data.
If you run a B2B SaaS product, CHS is probably the single most useful customer experience metric you can adopt.
9. NPS 3.0 / Earned Growth Rate
In November 2021, Fred Reichheld - the original creator of NPS - published a follow-up paper in Harvard Business Review acknowledging that NPS had been so widely gamed and misused that it needed a hard, complementary metric. He called the new framework NPS 3.0, and the metric at its center is the Earned Growth Rate.
Earned Growth Rate measures the portion of your revenue growth that comes from existing customers (through repeat purchases and through new customers they referred) rather than from paid acquisition.
The formula:
Earned Growth Rate = (Revenue from returning customers + revenue from their referrals) / Total revenue, year over year
What makes it useful is that it's derived from audited accounting data, not survey responses. That means it's almost impossible to manipulate, where the original NPS could be coached or gamed by employees with comp tied to the score.
To calculate Earned Growth Rate, you need two things most companies don't have today:
- A way to attribute each new customer to either paid acquisition or word-of-mouth referral (usually a single survey question at signup: "How did you hear about us?")
- A way to track revenue per customer over time so you can split current-period revenue between returning customers and newcomers
The setup work is real, but the metric you get out is one of the few customer experience indicators that's both customer-driven and accounting-grade. For mature SaaS companies that already have NPS in place and want a credible upgrade, NPS 3.0 and Earned Growth Rate are the natural next step.
How to run customer satisfaction surveys
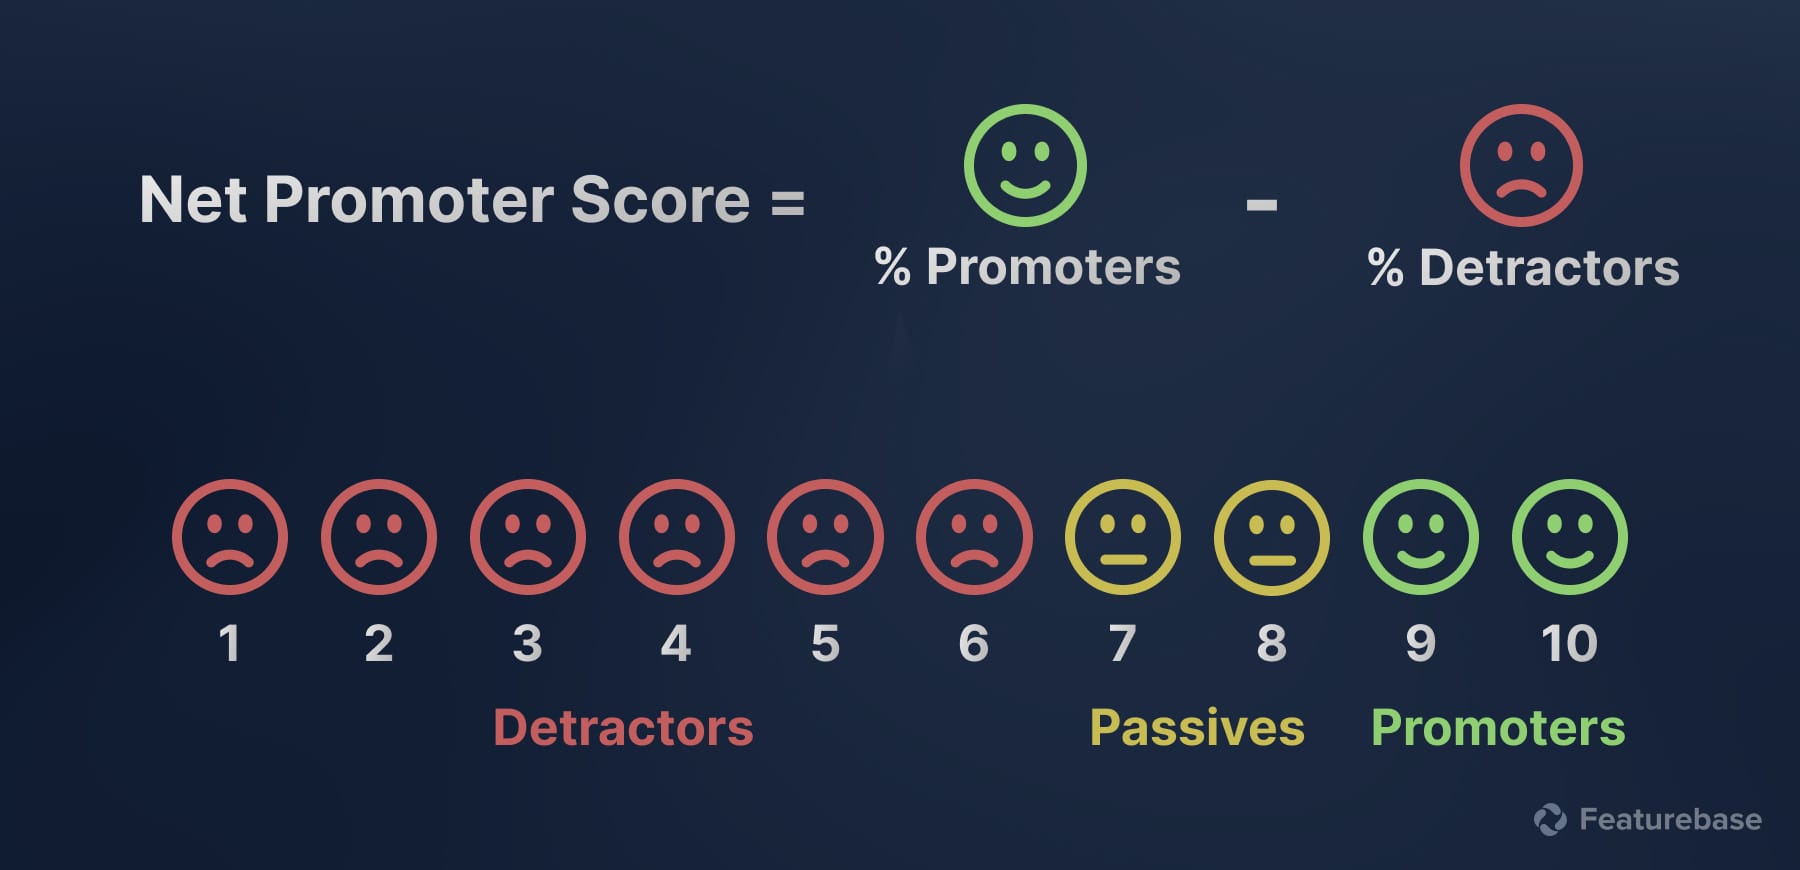
Now that you know the alternatives, here's how to actually run them. Most teams use a dedicated survey tool that integrates with their customer feedback system and CRM, so they can target the right users and connect responses back to customer data.
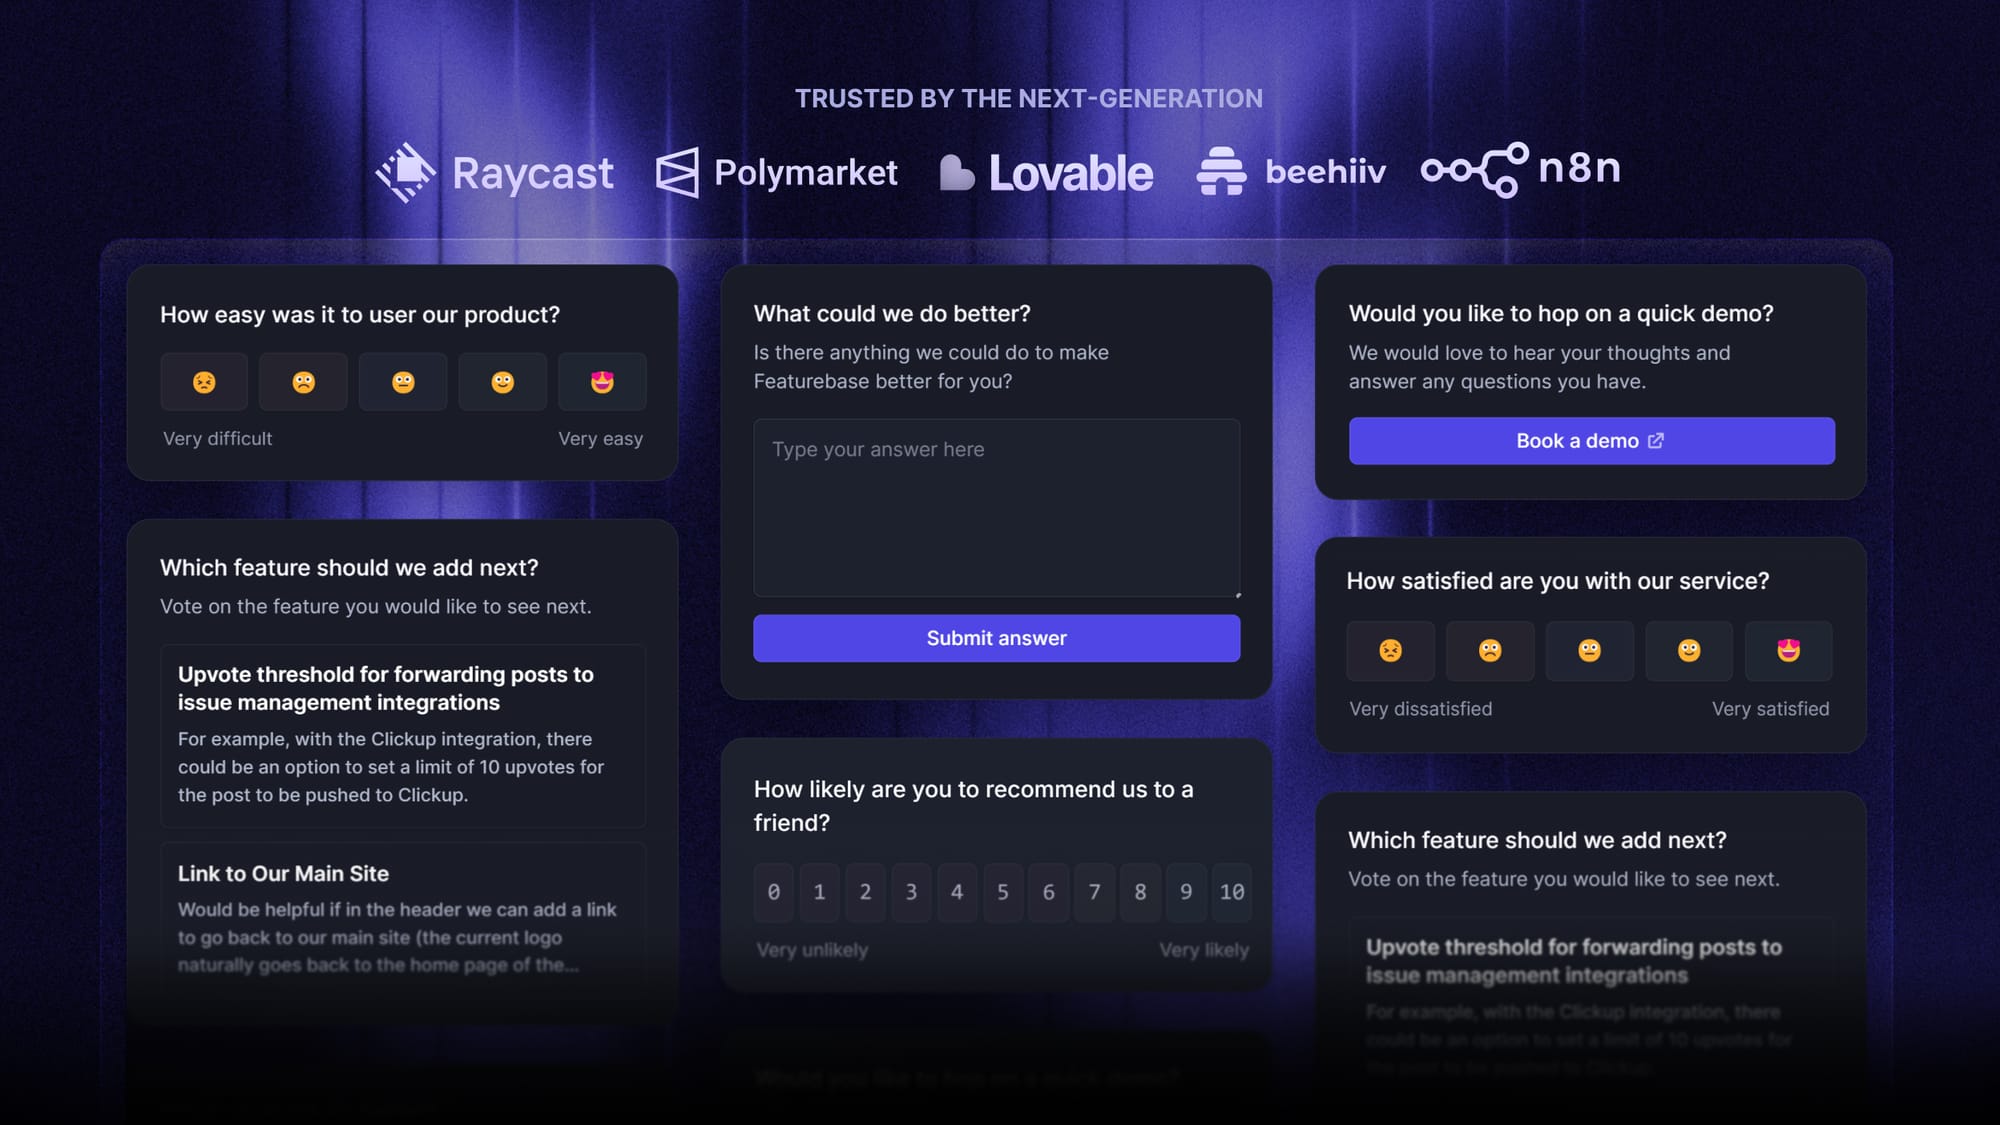
Featurebase is a modern feedback & support platform that helps product teams collect feedback through multi-step surveys, integrations, and a feedback portal, all in one place, to make better product decisions. It's loved by thousands of product teams from companies like Lovable, Raycast, and n8n. 💫
Top features:
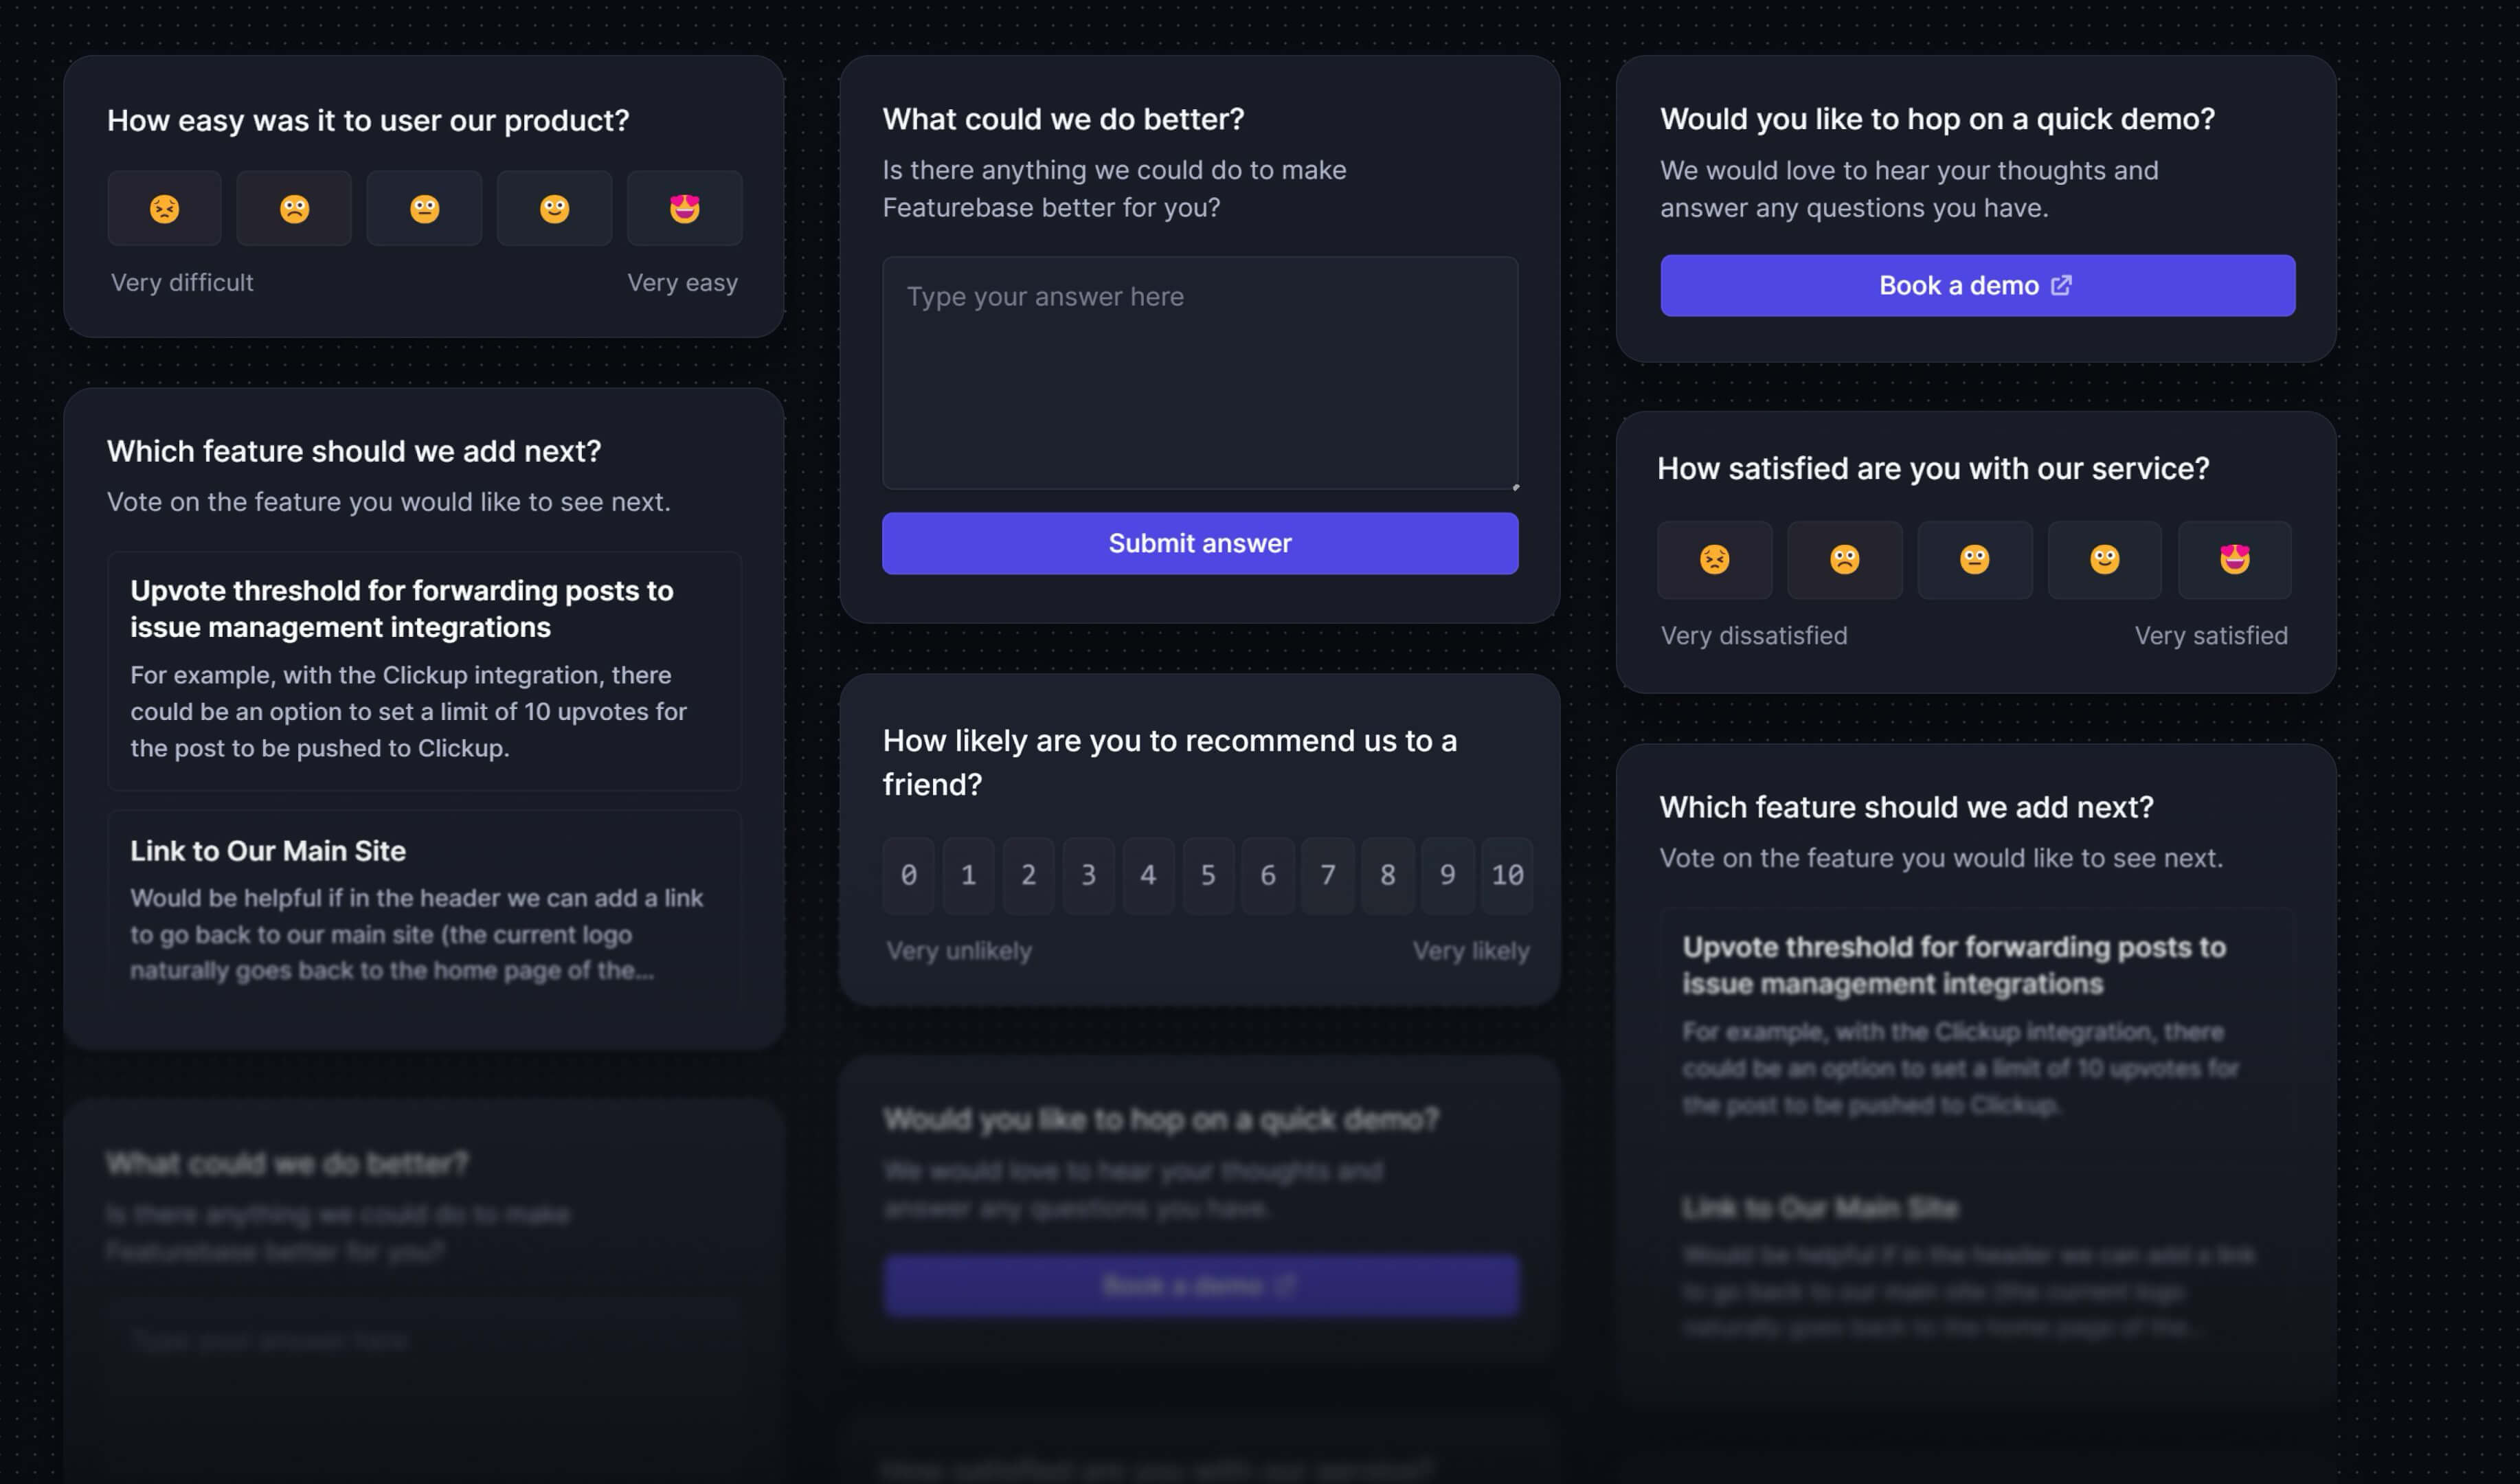
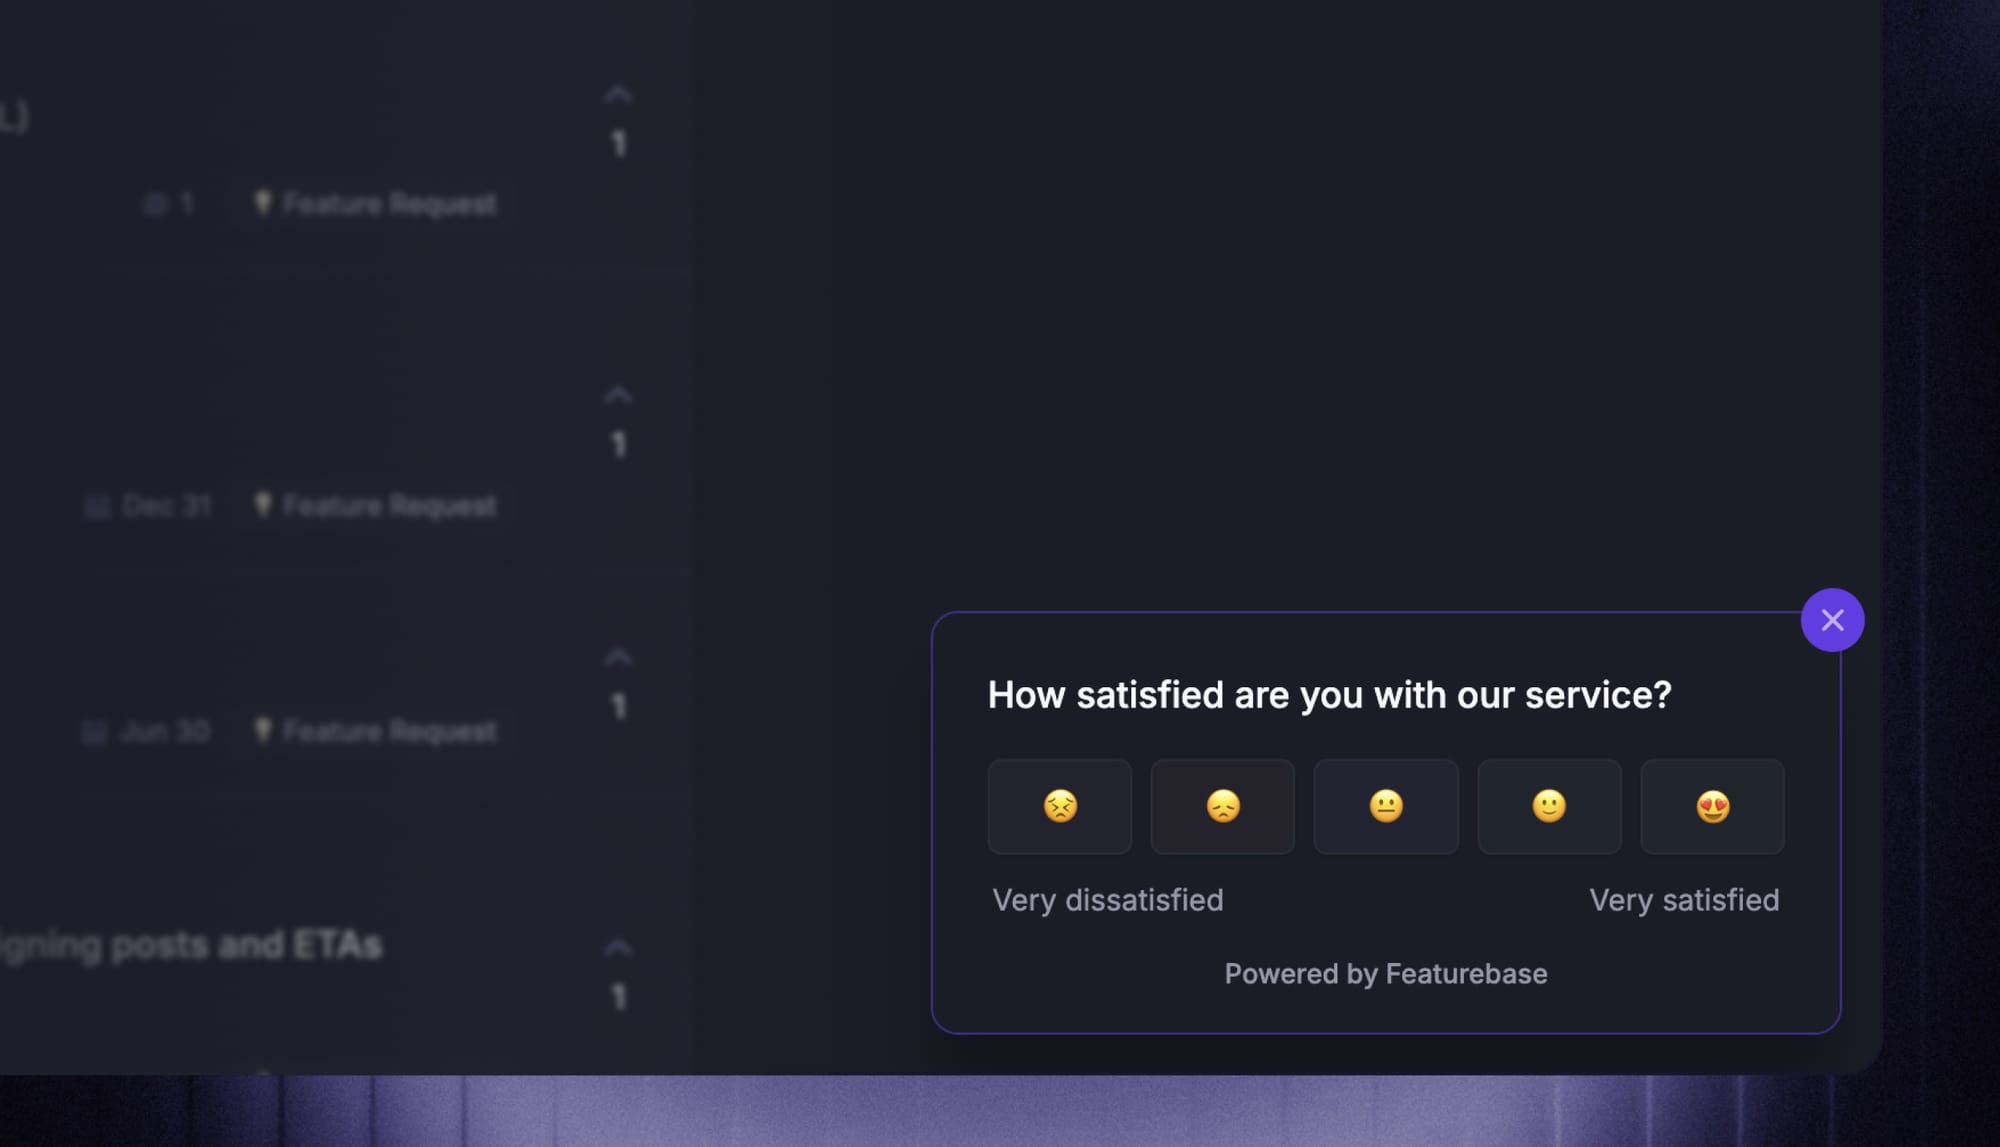
- Surveys (NPS, CSAT, etc) – Create targeted no-code surveys to ask users anything and measure customer satisfaction.
- User targeting – Target specific user segments based on properties like plan, role, location, etc.
- Conditional multi-step surveys – Ask follow-up questions based on conditional logic and users' answers.
- In-app widgets – Collect ideas, bug reports, and suggestions directly from your website or webapp with interactive widgets.
- Feedback forum – Public feedback forum where users can submit ideas and vote on features so you know what customers actually want.
- Prioritize by revenue – Link feedback with customer revenue, company size, and more to understand the real impact of ideas.
- Integrations – Connects with Slack, Linear, Jira, HubSpot, and more.
- Plus, help center, product roadmaps, release notes, and customer surveys – all in one place.
Pricing: Free plan available with unlimited survey responses and feedback. Paid plans start at $29/seat/mo.
The dedicated statistics page conveniently visualizes results. You can also connect your users' data to understand exactly who's behind the answers, helping you find data points relevant to your business model.
Start running surveys & collecting feedback
Create targeted NPS, CSAT, multiple-choice, or text response surveys for free
Conclusion
NPS is a popular method for gauging customer loyalty, but it's not the only tool in the toolbox. Instead of replacing it with alternatives to NPS, try to combine it with other feedback types for deeper insights on how customers interact with your business.
Featurebase is a modern feedback & support platform that helps you collect all feedback in one place with the help of surveys, integrations, and a public forum. You can connect your customer data to the feedback and prioritize ideas based on revenue, company size, and more to build what really matters.
It comes with affordable pricing and a Free Plan. You can automatically migrate over from any existing tools in seconds, so there's no downside to trying it. 👇
✨ Start running surveys & collecting feedback with Featurebase for free →
FAQs
Is NPS outdated?
NPS isn't outdated, but it's no longer considered sufficient on its own. As of 2026, only 23% of US enterprise CX leaders use NPS as their primary metric. The rest combine it with other CX metrics like CSAT, CES, and customer health scores to get the depth NPS can't provide on its own.
CSAT vs NPS vs CES - which should I use?
You should probably use all three. They measure different things, and we've written a full breakdown in our NPS vs CSAT comparison if you want to go deeper.
The short version:
- NPS measures customer loyalty - the likelihood that someone will recommend you.
- CSAT measures customer happiness with a specific interaction or product area.
- CES measures the effort someone had to put in to complete a task.
If you have to pick one, CSAT is usually the most actionable for product teams because it ties directly to specific experiences you can improve. NPS is more useful for tracking overall brand sentiment over time.
What is NPS 3.0?
NPS 3.0 is Fred Reichheld's 2021 follow-up framework that pairs the original NPS survey with Earned Growth Rate, an accounting-derived metric that measures how much of your revenue growth comes from returning customers and their referrals. The goal is to make NPS harder to game by anchoring it to audited financial outcomes.
How do I combine NPS with other CX metrics?
The most common stack is NPS + CSAT + CES, layered by use case:
- Run NPS quarterly to get a baseline loyalty signal.
- Run CSAT after every major customer touchpoint (purchase, support ticket, onboarding milestone) for transactional feedback.
- Run CES after specific actions that should be easy (canceling a plan, contacting support, finding billing info) to catch friction.
If you sell B2B SaaS, layer a customer health score on top so you can spot at-risk accounts before they churn.
Which NPS alternative is best for SaaS?
For SaaS, the highest-leverage alternative is the Customer Health Score (CHS) because it combines product usage, support history, and satisfaction signals into a single score that predicts renewal or churn 30+ days in advance. The runner-up is CES at key activation moments (sign-up, first-value, billing), since friction in those moments is the single most fixable cause of early churn.