Blog Customer FeedbackSuccess Metrics Examples: 30 KPIs and How to Use Them
Success Metrics Examples: 30 KPIs and How to Use Them
Explore 30 success metrics examples across finance, marketing, sales, support, product, and HR, plus how to choose the few KPIs that actually matter.

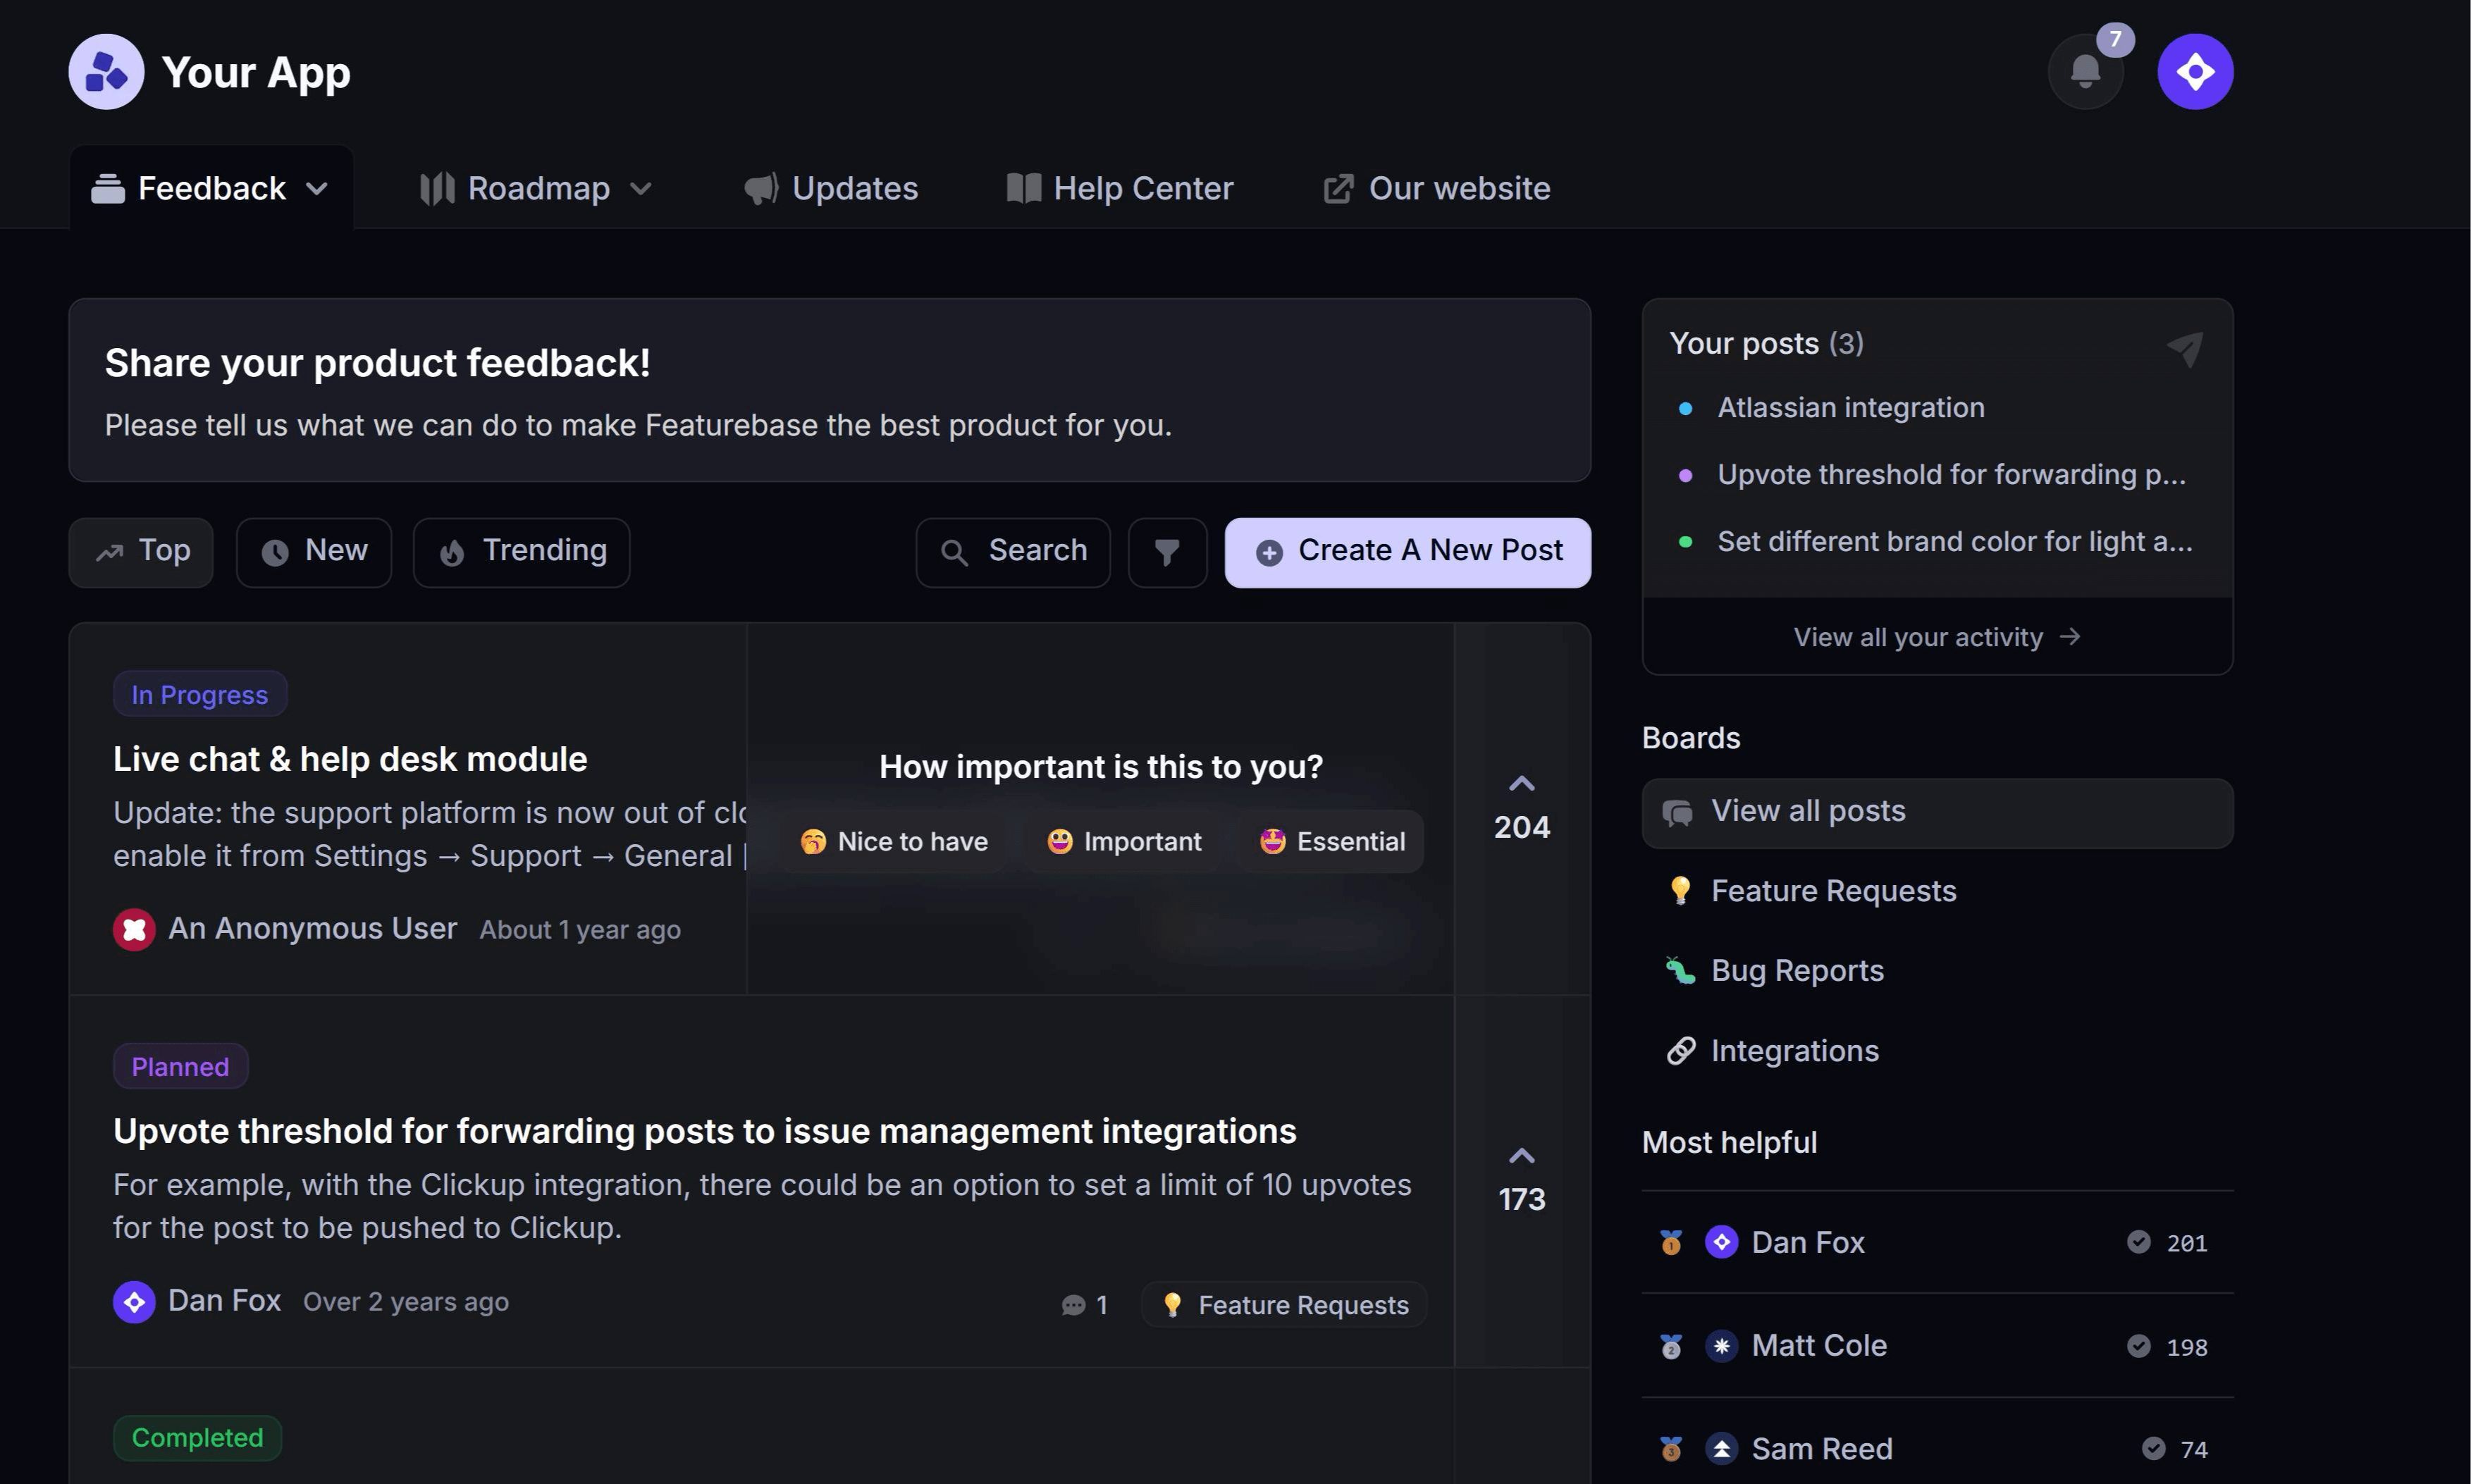

It is easy to end up with a dashboard full of numbers and still have no idea whether you are winning. Charts go up, charts go down, and none of it tells you if your strategy is actually working.
Success metrics fix that. The right ones turn a vague sense of progress into something you can measure, compare, and act on.
In this guide, I'll walk through 30 success metrics examples grouped by team, and how to pick the handful that actually matter for your goals. 👇
Key takeaways:
- Success metrics are quantifiable measures of whether your strategy is working. They are the same idea as KPIs, with KPIs being the most important subset.
- The best metric sets are small: aim for 5 to 10 per team. When you measure everything, you prioritize nothing.
- Balance leading and lagging indicators so you can both predict results and confirm them.
- Group your examples by function: finance, marketing, sales, customer success, product, and people each have their own success metrics.
- Avoid vanity metrics that look impressive but do not drive a single decision.
- Featurebase✨ turns customer feedback into a success metric you can track. Collect feature requests, run NPS and CSAT surveys, and close the loop with users, all in one place.
What are success metrics?
A success metric is a quantifiable measurement that tells you whether a strategy, project, or team is achieving its goal. If a goal is where you want to go, success metrics are how you know you are getting there.
You will often hear them called key performance indicators (KPIs). The two overlap heavily. The simplest way to think about it is that every KPI is a success metric, but a KPI is the small set you have singled out as most critical to a specific goal.
Measuring the right things is not busywork. Companies in the top third of their industry for data-driven decision-making were on average 5% more productive and 6% more profitable than their competitors, according to research reported in Harvard Business Review.
Good metrics do 3 things:
- Connect daily work to goals: they show each person how their tasks ladder up to something the business cares about.
- Reveal whether a strategy is working: measure a baseline before you start, then watch whether your numbers move after you act.
- Surface problems early: when one metric dips, you can pinpoint the weak spot before it spreads.
How to choose the right success metrics
With hundreds of possible metrics, the skill is not finding numbers to track. It is choosing the few that will actually change what you do.
Align every metric to a goal
Every metric you track should ladder up to a specific goal. If a number does not measure progress toward something you genuinely care about, it belongs on the cut list, not the dashboard.
A useful filter is the SMART test:
- Specific - the metric measures one clear thing
- Measurable - you can put a number on it
- Achievable - the target is realistic
- Relevant - it connects to a real business goal
- Time-bound - it is tied to a timeframe
Balance leading and lagging indicators
Most metrics are either leading or lagging, and you want a mix of both. Leading indicators predict future results, like pipeline volume or trial signups hinting at next quarter's revenue. Lagging indicators confirm what already happened, like quarterly revenue or churn rate. Leading indicators let you steer, and lagging indicators let you keep score.
Keep the list short
Aim for 5 to 10 metrics per team. When you measure everything, you prioritize nothing, and the signal you care about gets buried under noise. Pick the few that map to this quarter's goals, and revisit them as priorities shift.
30 success metrics examples by team
Here are 30 success metrics grouped by function. You will not need all of them. Treat this as a menu: pick the ones that match your team's goals and ignore the rest.
Financial and business metrics
- Recurring revenue (MRR/ARR): the predictable revenue from active subscriptions in a month or a year. It is the clearest health signal for any subscription business.
- Gross profit margin: the revenue left after the cost of goods sold, shown as a percentage. It tells you how efficiently you turn sales into profit.
- Return on investment (ROI): the ratio of gain to cost for an initiative. It answers whether an investment was worth making.
- Customer acquisition cost (CAC): the total sales and marketing spend needed to win one new customer. It only means something next to lifetime value.
- Cash runway: how many months you can operate before running out of money at your current burn rate. It quietly decides how much time you have to hit your goals.
Marketing metrics
- Marketing qualified leads (MQLs): the number of leads engaged enough to hand to sales. It measures whether marketing is filling the pipeline with the right people.
- Conversion rate: the percentage of visitors or leads who take a desired action. It shows how well your funnel turns interest into action.
- Cost per lead (CPL): the average spend to generate one lead. Watch the trend, since it should fall as your channels get more efficient.
- Organic traffic: the number of visitors arriving from unpaid search. It is a leading indicator of long-term, compounding demand.
- Return on ad spend (ROAS): the revenue generated per dollar of ad spend. It separates campaigns that pay for themselves from those that burn budget.
Sales metrics
- Lead-to-customer conversion rate: the percentage of leads that become paying customers. It reflects both lead quality and how well your team closes.
- Average deal size: the average revenue per closed deal. A rising number often signals you are moving upmarket.
- Sales cycle length: the average time from first contact to closed deal. Shorter cycles mean faster, more predictable revenue.
- Win rate: the percentage of opportunities that end in a sale. It is a direct read on the effectiveness of your sales motion.
- Pipeline coverage: the value of open opportunities relative to your quota. It tells you early whether there is enough in the pipeline to hit the number.
Customer success and support metrics
- Net promoter score (NPS): a 0-to-10 measure of how likely customers are to recommend you. It is the most common gauge of loyalty.
- Customer satisfaction score (CSAT): a short-term rating of how happy customers are with a specific interaction or product.
- Customer churn rate: the percentage of customers who stop doing business with you over a period. It is the metric that quietly caps your growth.
- Customer lifetime value (CLV): the total profit you expect from a customer across the whole relationship. It sets the ceiling on what you can spend to acquire one.
- First response time: how quickly your team replies to a customer request. Fast responses correlate strongly with higher satisfaction.
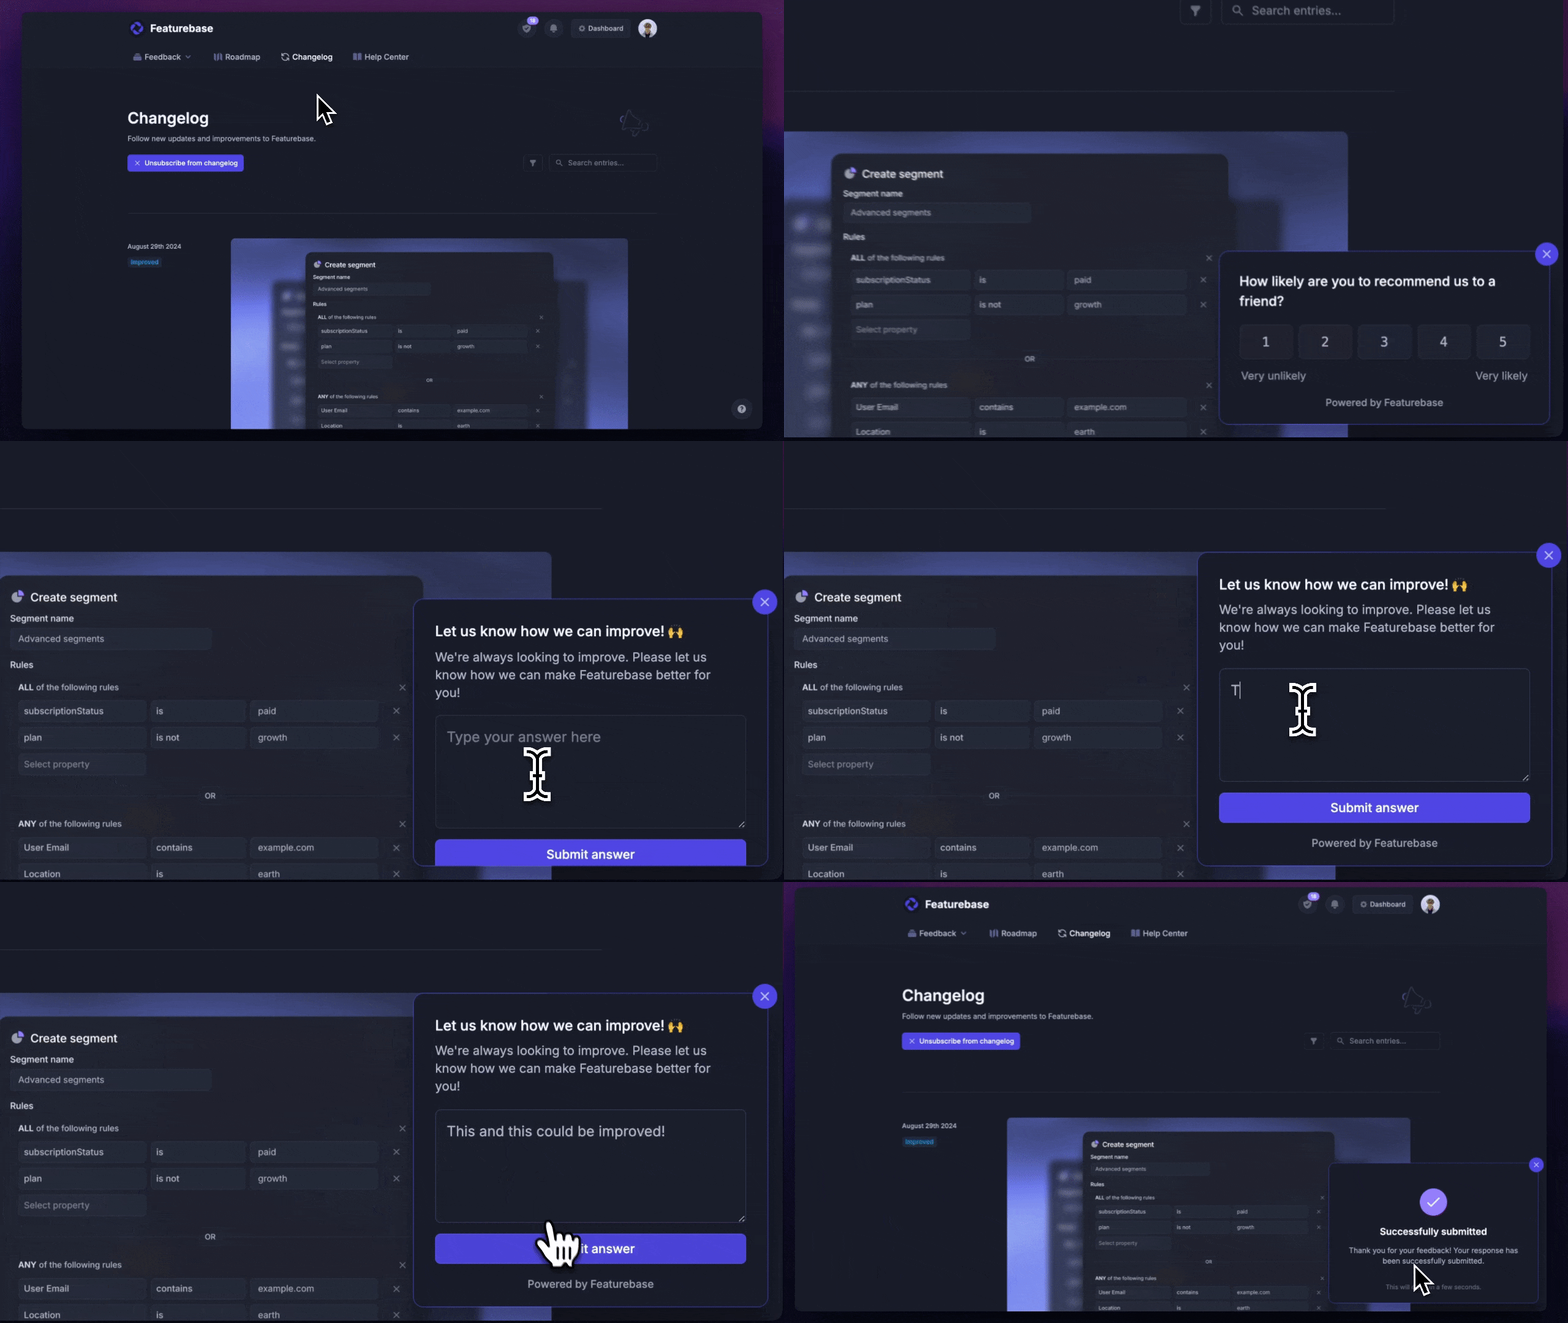
NPS and CSAT both depend on actually collecting customer feedback, and that is where a lot of teams stall. With Featurebase you can run targeted NPS and CSAT surveys, gather feature requests in a public feedback forum, and see which requests come from your highest-revenue accounts. A soft signal like "customer sentiment" becomes something you can measure and trend over time.
Product metrics
- Activation rate: the percentage of new users who reach a key first-value moment. It predicts whether signups will stick around.
- Daily and monthly active users (DAU/MAU): the count of users engaging daily or monthly, and the ratio between them. Together they show how habitual your product is.
- Feature adoption rate: the share of active users who use a specific feature. It tells you whether what you shipped actually landed.
- Retention rate: the percentage of users still active after a set period. It is the single best long-term signal of product-market fit.
- Time to first value (TTFV): how long it takes a new user to reach their first meaningful outcome. Shorter is better, especially during onboarding.
People and HR metrics
- Employee net promoter score (eNPS): how likely employees are to recommend your company as a place to work. It often predicts customer satisfaction down the line.
- Employee retention rate: the percentage of employees who stay over a given period. High turnover is expensive and slows everything down.
- Time to hire: the average number of days to fill an open role. It directly affects how fast you can grow the team.
- Absenteeism rate: the share of scheduled work time lost to unplanned absence. A rising number can be an early warning of disengagement.
- Revenue per employee: total revenue divided by headcount. It is a simple read on overall workforce productivity.
Common mistakes to avoid
How you track metrics matters as much as which ones you pick. Watch for these traps:
- Chasing vanity metrics: follower counts and raw pageviews look impressive but rarely drive decisions. Track metrics tied to conversion, revenue, or retention instead.
- Tracking too many things: a 40-metric dashboard hides the 5 numbers that actually matter. Cut anything that does not inform a decision.
- Measuring activity instead of outcomes: calls made or features shipped are effort, not results. Tie every metric to what actually changed for the user or the business.
- Changing definitions midstream: if you redefine "active user" every quarter, you cannot compare over time. Lock in how each metric is calculated up front.
- Never acting on the data: a metric you review but never respond to is just decoration. Build a regular cadence to turn numbers into decisions.
Turn your metrics into action with Featurebase
Metrics like NPS, CSAT, feature adoption, and churn all trace back to one thing: understanding what your customers actually want. That is exactly what Featurebase is built for.
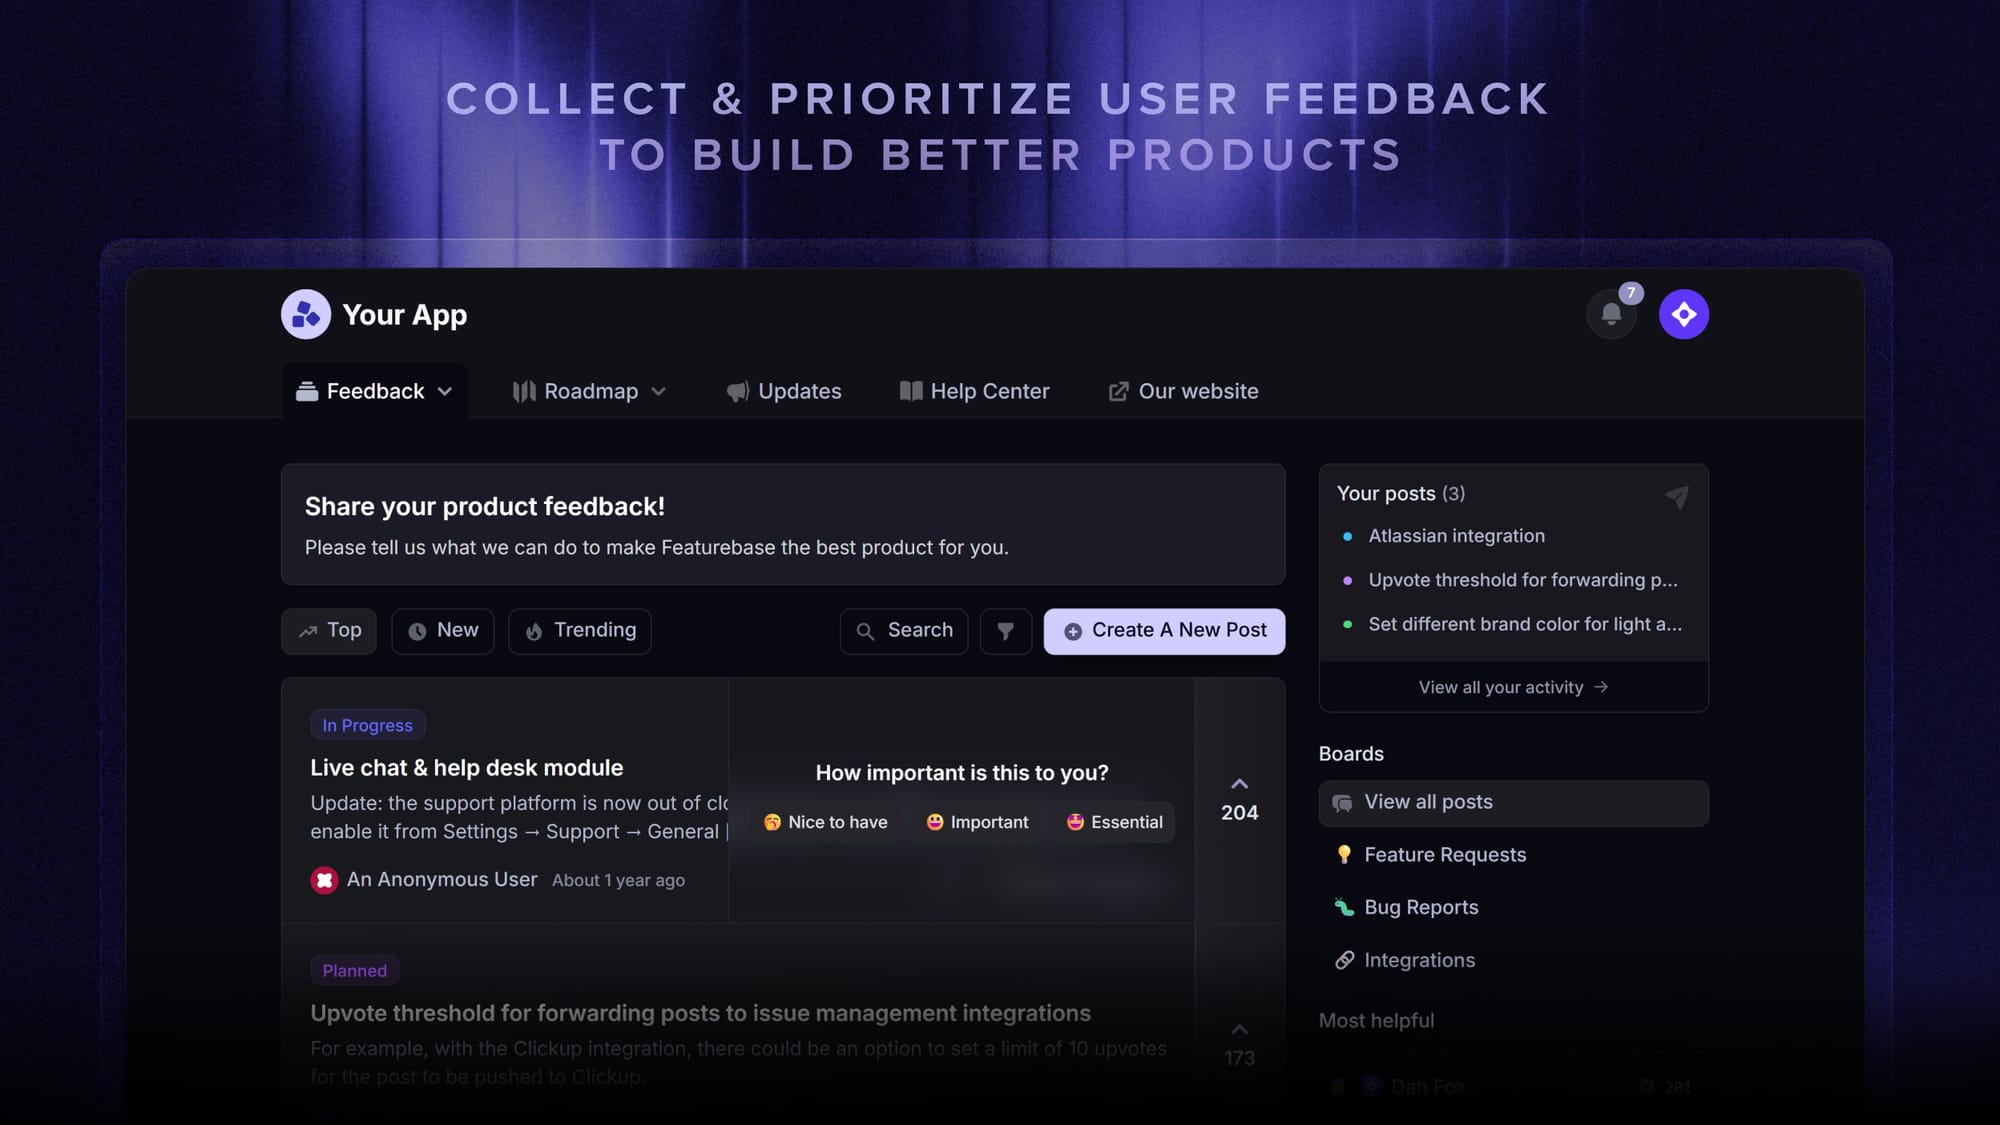
Featurebase is a modern feedback & support platform that helps product teams collect feedback, prioritize features, build roadmaps, and announce product updates – all in one place. It's loved by thousands of product teams from companies like Lovable, Raycast, and n8n. 💫
Top features:
- Feedback forum – Public feedback forum where users can submit ideas and vote on features helping you know what customers want
- In-app widgets – Embed feedback, changelog, and help center widgets directly in your product
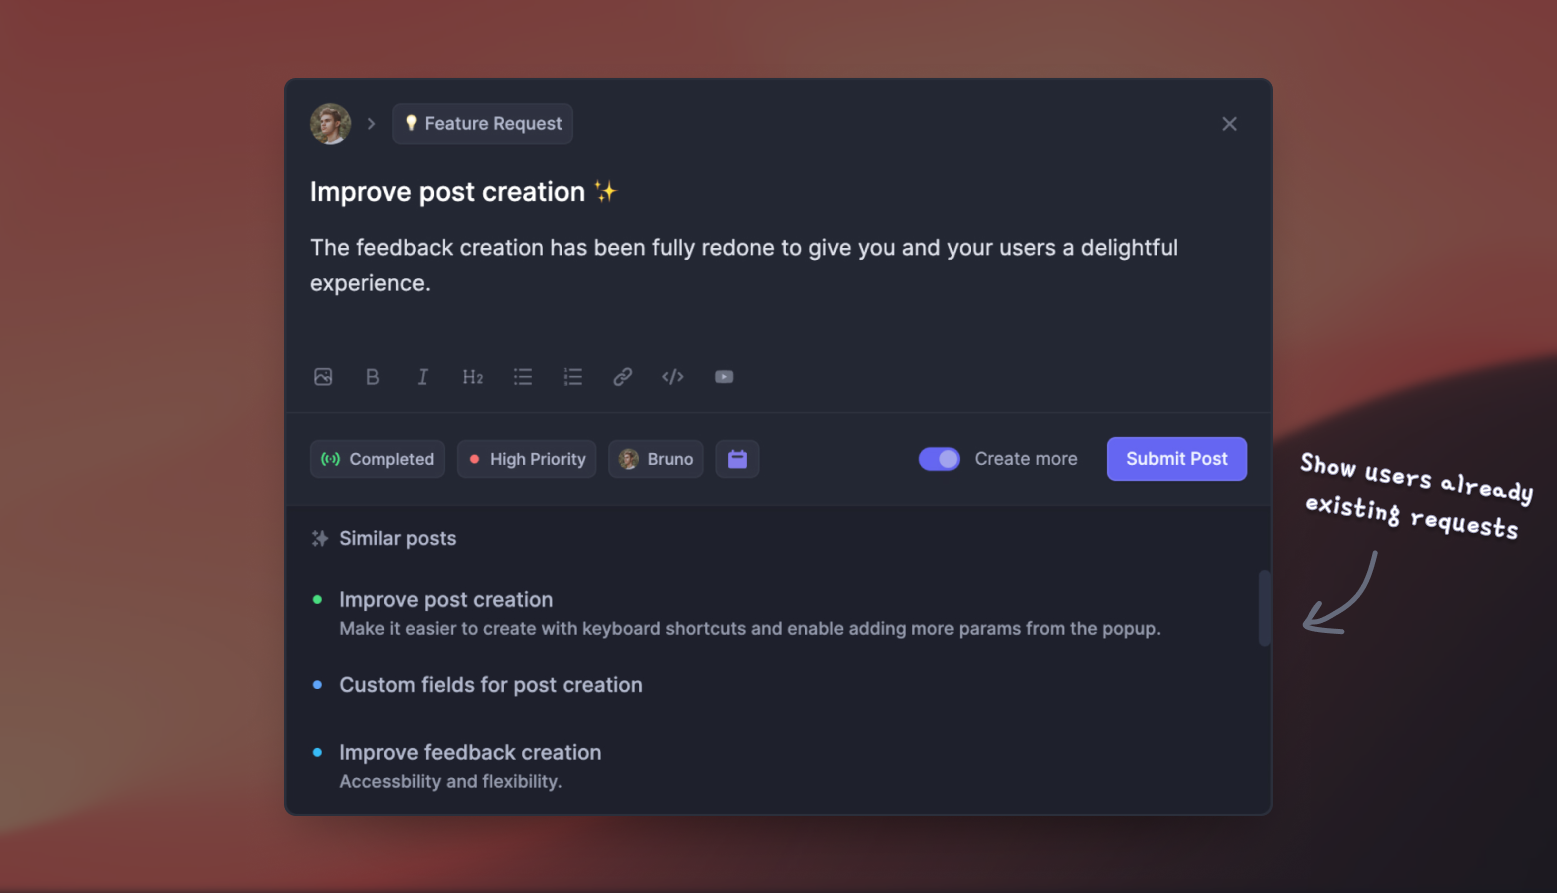
- Prioritize by revenue – Link feedback with customer revenue, company size, and much more to better understand the impact of ideas
- AI feedback categorization - Automatically group large volumes of feedback into product areas, projects, or themes with AI
- Automated email updates – Automatically notify users when their requested features are implemented
- Roadmaps – Create internal & public product roadmaps to keep users informed and build engagement
- Product updates – Publish release notes with a changelog page, in-app widget, and emails
- Surveys (NPS, CSAT, etc) – Create targeted surveys to ask users anything and measure customer satisfaction
- Automatic AI translations – Automatically translate all feedback and comments to your customers and teammates native languages
- Integrations – Connects with Slack, Linear, Jira, HubSpot, and more
Pricing: Free plan available with unlimited feedback collection. Paid plans start at $29/seat/mo.
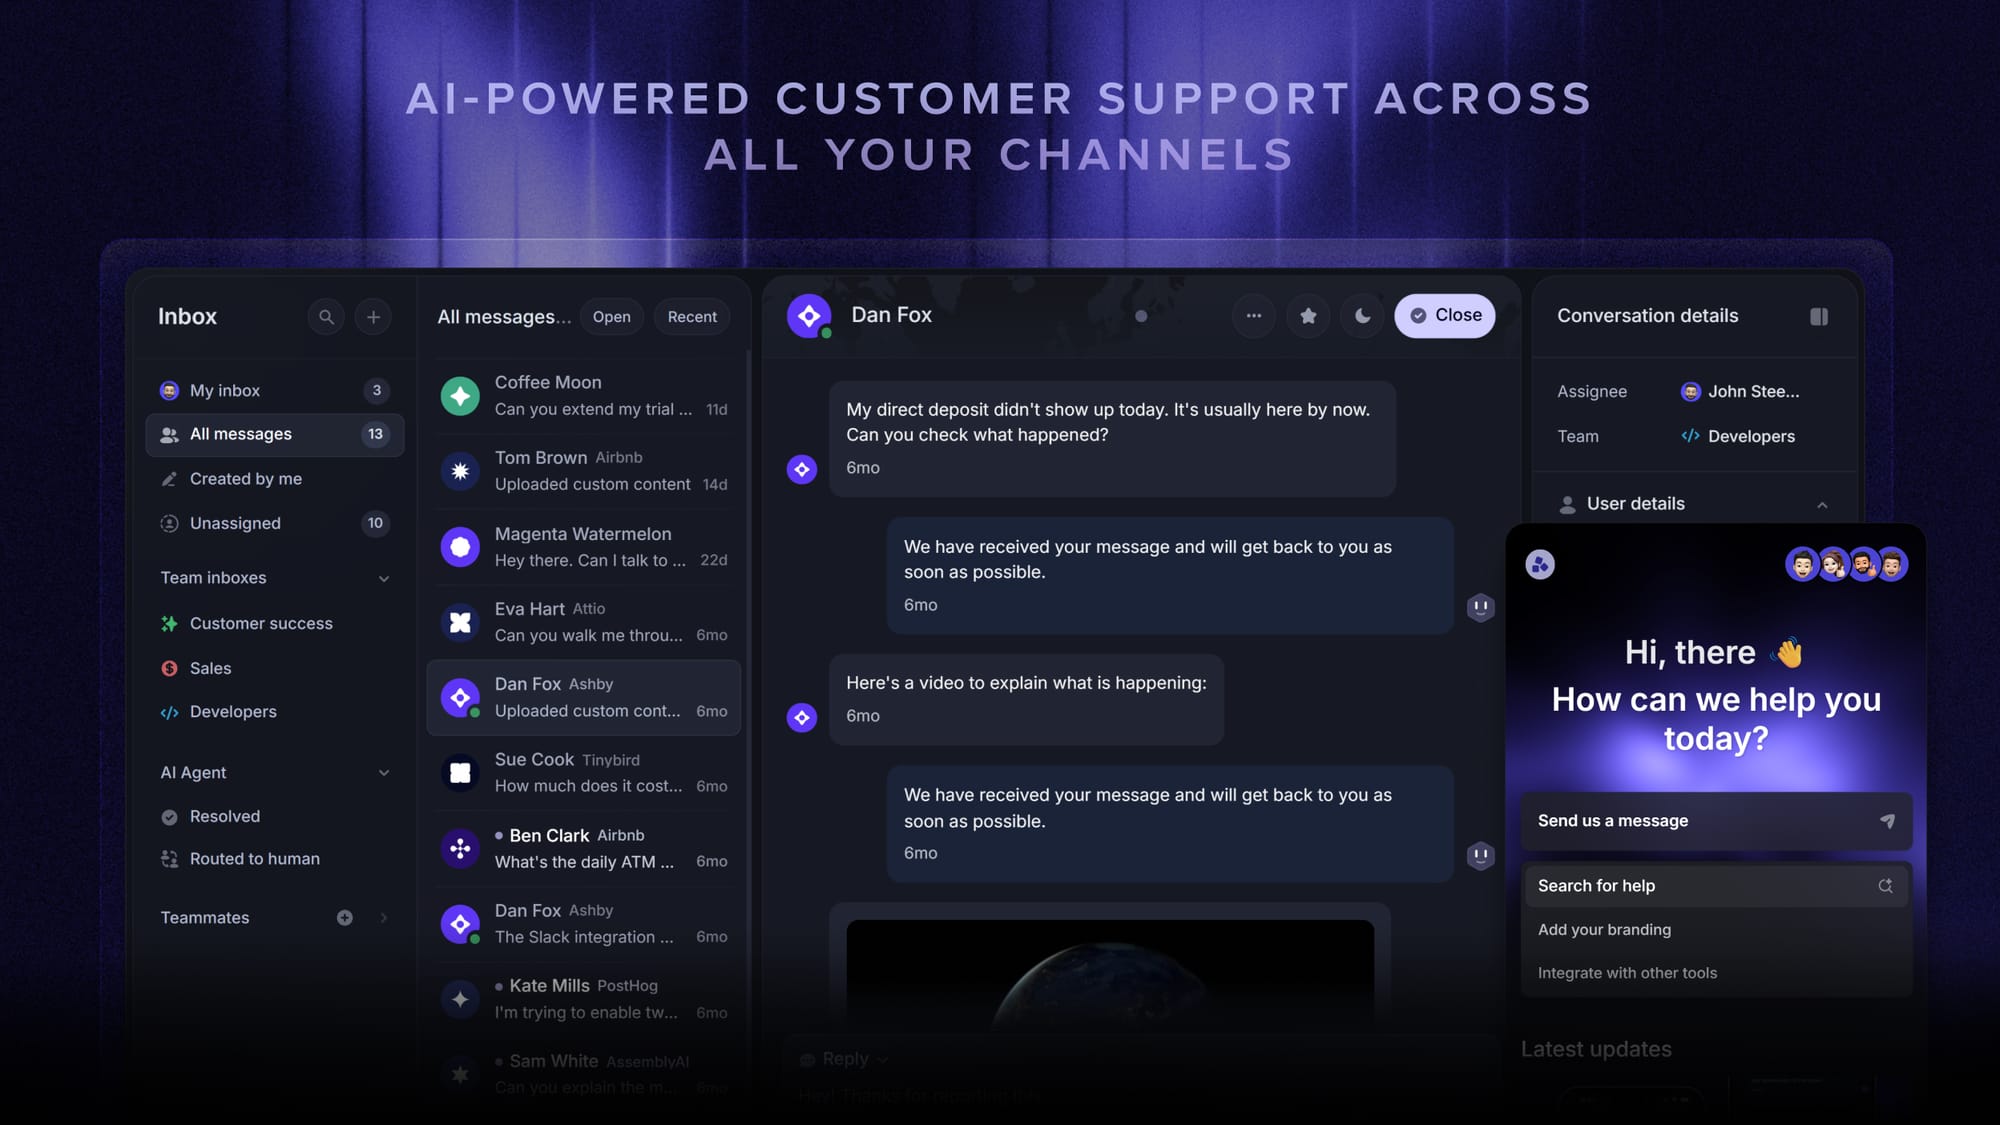
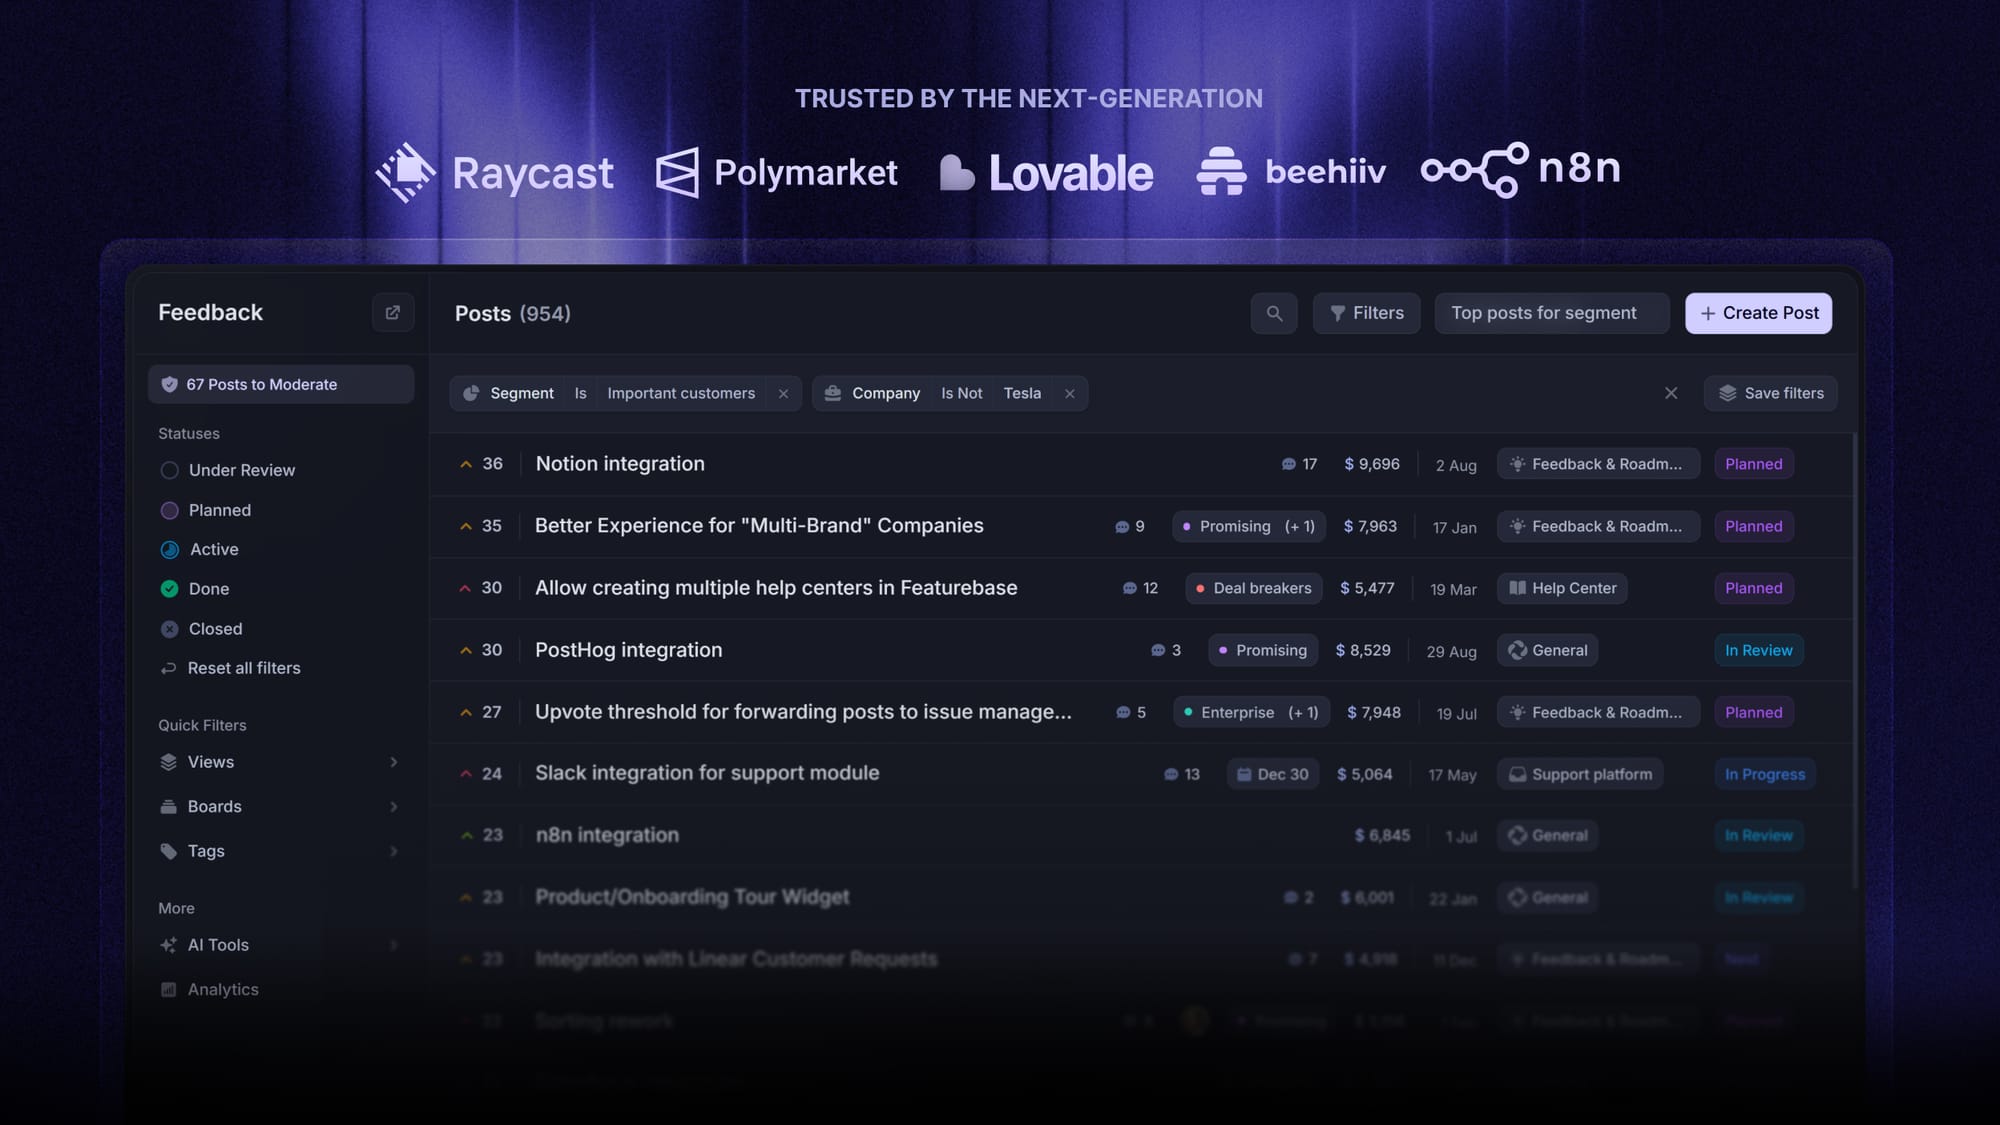
Instead of having 4+ different tools, Featurebase enables you to replace all your customer-facing tools by bringing your feedback collection, product updates, support, and help center together in one place to help you build products your users love.
Conclusion
The best metric program is not the biggest one. It is the short, deliberate list that maps to your goals, mixes leading and lagging signals, and gets reviewed often enough to change what you do next.
Start with the handful of examples above that fit your team, define each one clearly, and build the habit of acting on what they tell you. And when the metrics that matter most point back to what your customers actually want, the fastest way to move them is to listen directly.
Featurebase helps product teams turn customer feedback into a success metric you can act on. Collect feature requests, run NPS and CSAT surveys, prioritize ideas by revenue, and close the loop with product updates, all in one place.
Featurebase comes with a Free Plan that includes unlimited feedback collection, so there's no downside to trying it. 👇
✨ Start collecting & managing feedback with Featurebase for free →
FAQs
What is the difference between a success metric and a KPI?
All KPIs are success metrics, but not all success metrics are KPIs. A success metric is any quantifiable measure of progress, while a KPI is the small subset you have flagged as most critical to a specific goal, with a target and a timeframe attached. If a number does not inform a decision, it is a metric worth watching rather than a KPI worth reporting.
What are leading and lagging indicators?
Leading indicators predict future performance, like pipeline volume or trial signups. Lagging indicators measure results that have already happened, like quarterly revenue or churn rate. You want both, because leading indicators let you steer before it is too late and lagging indicators confirm whether your bets paid off.
How many success metrics should you track?
Most teams do best with 5 to 10 metrics, and individuals with even fewer. Tracking too many splits your focus and buries the numbers that actually matter. Pick the handful that map to your current goals, and revisit the list each quarter as priorities change.
What is a vanity metric?
A vanity metric is a number that looks impressive but does not help you make decisions, like total pageviews, social followers, or app downloads. The test is simple: if you cannot explain what caused the number to move or what you would do differently because of it, it is probably vanity. Swap it for a metric tied to conversion, revenue, or retention.
How often should you review your success metrics?
Match the cadence to how fast each metric moves. Fast-moving numbers like web traffic or signups reward weekly reviews, while slower ones like customer lifetime value suit monthly or quarterly check-ins. As a baseline, review the metric set itself every quarter to confirm you are still tracking the right things.
How do you measure customer feedback as a success metric?
Turn qualitative feedback into signals you can count. Track structured scores like NPS and CSAT for sentiment, and quantify feature requests by volume and by the revenue of the accounts asking for them. Tools like Featurebase let you run those surveys and collect feature requests in one place, so "what customers think" becomes a metric you can trend over time rather than a gut feeling.