Blog Customer FeedbackCustomer Success Metrics: 12 KPIs to Track in 2026
Customer Success Metrics: 12 KPIs to Track in 2026
Discover the 12 customer success metrics that actually predict retention and expansion in 2026, with formulas, benchmarks, and how to choose the right ones for your team.


✨ Start collecting & managing feedback with Featurebase for free →
Most customer success teams don't have a data problem. They have a too-much-data problem: dozens of dashboards, and no clarity on which numbers actually predict whether a customer renews, expands, or quietly slips away.
The fix is to track fewer metrics, but the right ones, and to know what each one is really telling you.
This guide covers 12 customer success metrics worth tracking in 2026, grouped by what they measure, with formulas, benchmarks, and how to pick the handful that fit your business. 👇
Key takeaways:
- Customer success metrics fall into 3 buckets: revenue and retention, product health and adoption, and satisfaction and sentiment. Track at least one from each rather than everything at once.
- Net revenue retention (NRR) is the closest thing to a single headline number, because it folds churn, downgrades, and expansion into one figure that leadership and investors already understand.
- Pair lagging metrics like churn and renewals with leading ones like engagement, sentiment, and effort, so you can act before revenue moves, not after.
- Tie every metric to a business outcome such as protected revenue or reduced support load, or it becomes a vanity number nobody acts on.
- You can capture the voice-of-customer signals behind many of these metrics, from NPS and CSAT to feature requests, with Featurebase✨.
What are customer success metrics?
Customer success metrics are the indicators that show whether your customers are actually reaching their goals with your product, and whether that translates into retention, expansion, and loyalty. Unlike acquisition metrics, which measure how well you win customers, success metrics measure what happens after the sale, where most subscription revenue is actually won or lost.
They matter because retention compounds. Research from Bain & Company found that a 5% increase in customer retention can lift profits by 25% to 95%, depending on the industry. Small, durable improvements in the metrics below have an outsized effect on the bottom line.
It helps to sort customer success metrics into 3 groups, each answering a different question:
- Revenue and retention: are customers staying, and are they worth more over time?
- Product health and adoption: are customers actually using the product and getting value from it?
- Satisfaction and sentiment: how do customers feel, and how much effort does the relationship cost them?
The strongest programs track a few metrics from each group, because any single bucket on its own hides problems the others would catch.
Revenue and retention metrics
These are the numbers your board cares about most. They prove, in dollars, whether customer success is protecting and growing revenue.
Net revenue retention (NRR)
Net revenue retention (also called net dollar retention) measures how much recurring revenue you keep and grow from existing customers over a set period, including upsells and cross-sells and after accounting for downgrades and churn.
NRR = [(Starting recurring revenue + expansion − contraction − churn) ÷ starting recurring revenue] × 100
An NRR above 100% means your existing base is growing on its own, even before you add a single new customer. It's the closest thing customer success has to a single headline metric, because it captures retention and expansion in one number. According to SaaS Capital's 2025 benchmarks, the median NRR for private B2B SaaS companies with $25,000 to $50,000 ACV is 102%, with the top quartile at 111%.
Gross revenue retention (GRR)
Gross revenue retention shows the percentage of recurring revenue you keep, without the flattering effect of expansion. It only accounts for what you lost to churn and downgrades, so it can never exceed 100%.
GRR = [(Starting recurring revenue − contraction − churn) ÷ starting recurring revenue] × 100
GRR is the honest counterpart to NRR. A healthy NRR can mask a leaky base if a few big upsells are papering over widespread churn, and GRR is where that shows up. A GRR above 90% signals that most customers are staying put with minimal losses.
Customer churn rate
Churn rate is the percentage of customers (or revenue) you lose in a given period. It's the single most direct measure of whether your product and experience are keeping people around.
Customer churn rate = (customers lost during the period ÷ customers at the start of the period) × 100
For most SaaS businesses, a monthly churn rate under 2% is strong, and anything over 5% points to a gap worth fixing. Rising churn rarely has one cause. It usually reflects some mix of poor-fit acquisition, weak onboarding, and low product adoption, which is exactly why the other metrics in this guide matter. If churn is climbing, the right move is often better customer retention software and a closer look at where value delivery breaks down.
Customer lifetime value (CLV)
Customer lifetime value estimates the total revenue a single customer generates across their entire relationship with you. It tells you how much you can afford to spend on acquiring and keeping customers.
CLV = average revenue per customer × average customer lifespan (a common SaaS shortcut is MRR ÷ churn rate)
CLV is most useful segmented by acquisition channel, industry, or customer size, because it reveals which customers are actually worth the investment. When CLV rises, it usually signals that onboarding, adoption, and expansion are all working together.
Customer retention cost (CRC)
Customer retention cost measures how much you spend to keep each customer, including customer success salaries, tooling, onboarding, and customer marketing. Compared against CLV, it tells you whether your retention engine actually pays for itself.
CRC = total customer success and retention costs ÷ number of active customers
The point of CRC is efficiency. It's almost always cheaper to keep a customer than to win a new one, but only if your retention spend doesn't outrun the revenue those customers bring in. A healthy program keeps a comfortable gap between CLV and CRC and looks to automation to scale retention without simply adding headcount.
Product health and adoption metrics
Customers don't renew products they don't use. These metrics catch disengagement months before it hits your revenue numbers.
Product adoption rate
Product adoption rate is the percentage of new users who start using your product regularly as part of their day-to-day work. It looks at how deeply and how often customers engage, not just whether they logged in once.
Product adoption rate = (new active users ÷ total signups) × 100
Benchmarks vary by product, but a healthy adoption rate typically sits between 40% and 60%. Low adoption usually points back to onboarding friction or a mismatch between what customers signed up for and what they actually do with the product. Tracking feature adoption alongside overall adoption shows whether customers are reaching the capabilities that drive real value.
Active usage (DAU / WAU / MAU)
Active usage tracks how many unique users take meaningful actions in your product over a given window: daily, weekly, or monthly active users. It's one of the most reliable leading indicators of both churn and expansion.
Common cuts include DAU/MAU and WAU/MAU ratios, which show how sticky your product is (a DAU/MAU above 0.4 is a common benchmark for collaboration tools).
Declining usage almost always precedes churn, so a drop in active users is your earliest warning to reach out. On the flip side, accounts pushing against their usage or seat limits are often your clearest expansion opportunities.
Customer health score
A customer health score blends multiple signals into a single index that shows whether an account is thriving, at risk, or ripe for expansion. There's no universal formula, which is the point: you weight the signals that matter for your product.
Customer health score = weighted blend of usage, support history, survey scores, and sentiment
Most teams combine quantitative inputs like login frequency and feature adoption with qualitative ones like NPS, CSAT, and open feedback, then set color-coded bands (for example, green, yellow, red) to trigger the right play. The qualitative side is where a lot of teams fall short. Pulling in structured voice-of-customer signals makes a health score far more predictive than usage data alone.
With Featurebase, you can feed that qualitative side directly. A public feedback forum captures what customers are actually asking for, and because you can prioritize feedback by customer revenue and company size, you can see which requests come from your highest-value, highest-risk accounts and factor that into their health score.
Time to value (TTV)
Time to value measures how long it takes a new customer to reach their first meaningful outcome after signing up. Shorter TTV correlates with higher satisfaction, better retention, and stronger references.
TTV = time from signup (or purchase) to first measurable result
You can measure it in a few ways: time to first login, time to complete onboarding, or time to a defined value milestone. A benchmark of under 30 days is a reasonable target for many products, but the real work is defining the "moments that matter" that signal a customer has actually gotten value, then removing the friction between signup and those moments.
Satisfaction and sentiment metrics
Usage tells you what customers do. These metrics tell you how they feel, which often shifts before the behavior does.
Net promoter score (NPS)
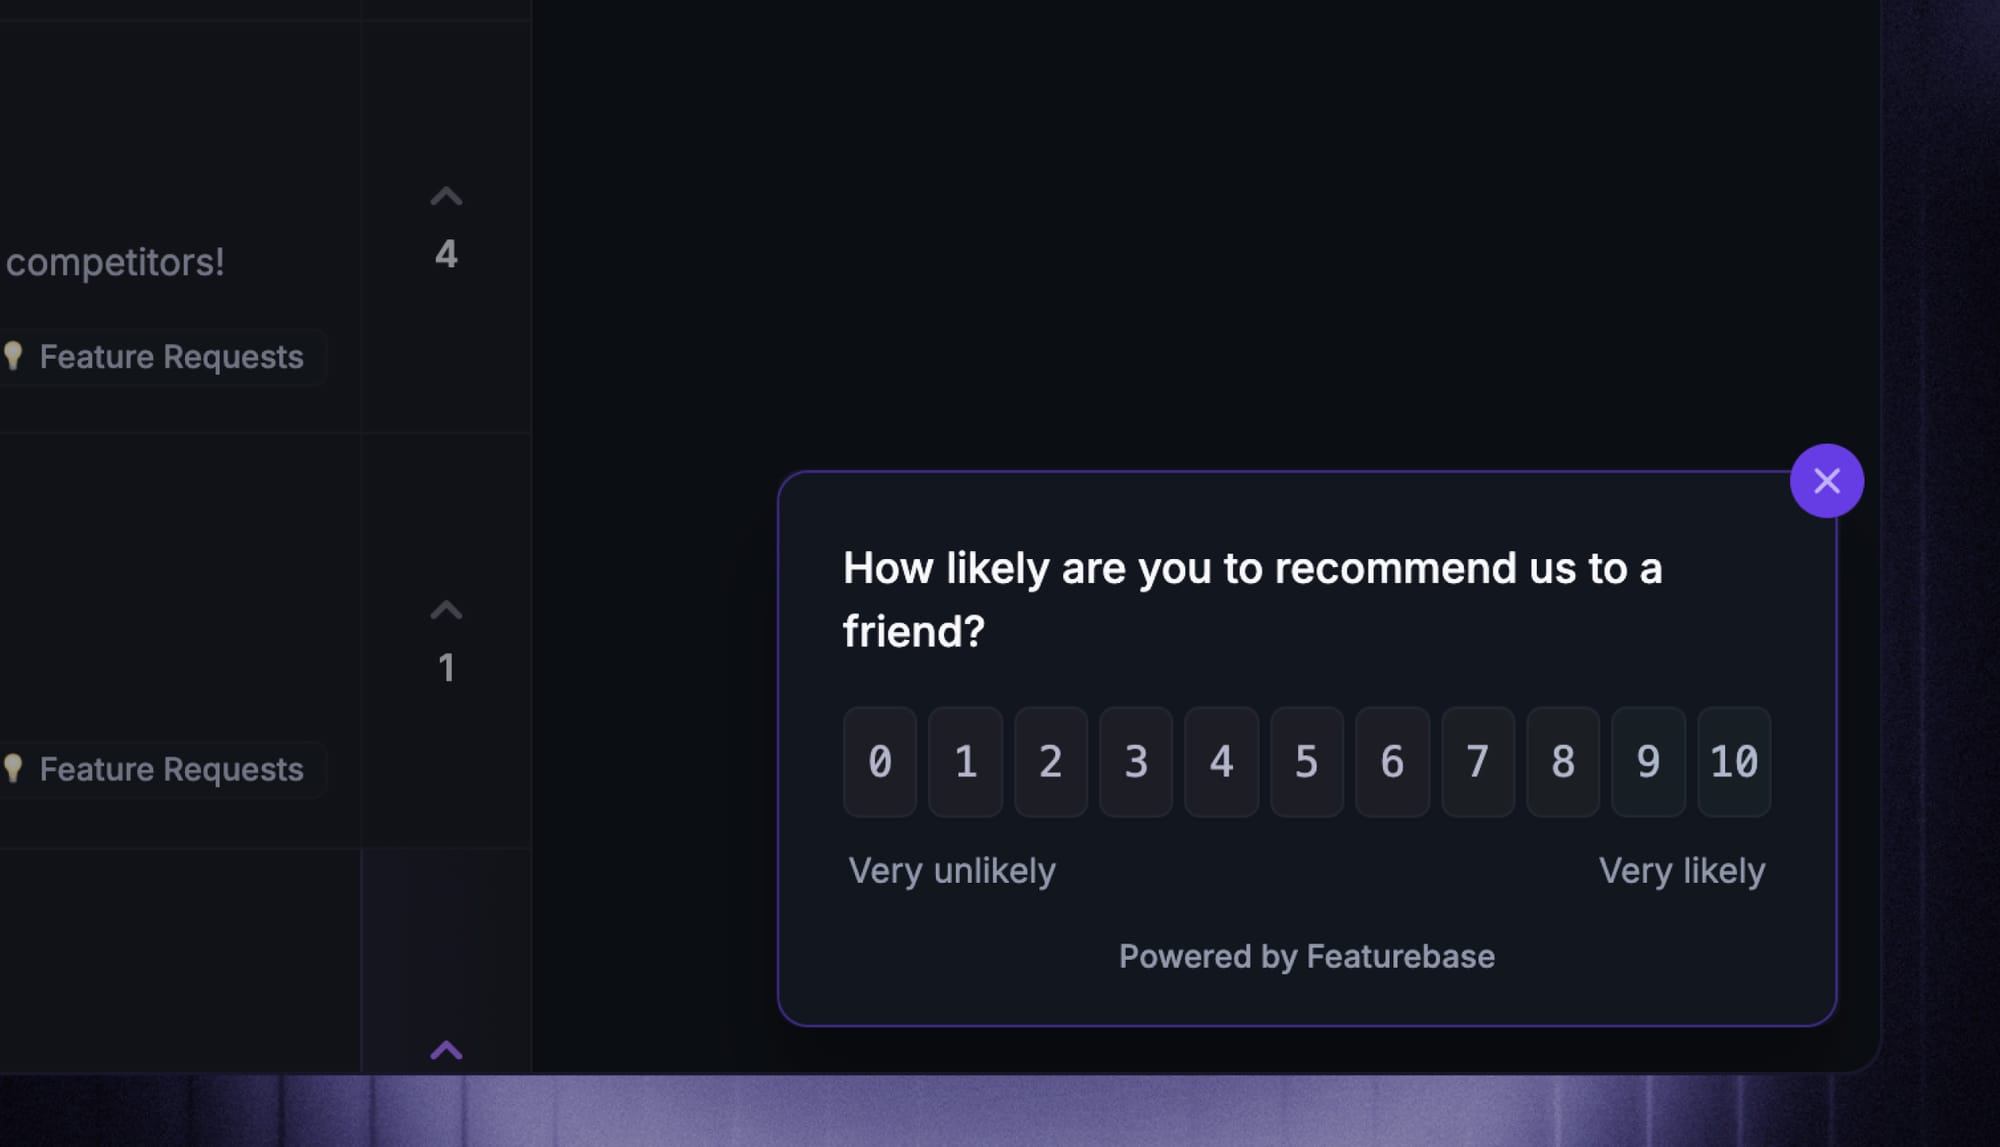
Net promoter score measures loyalty by asking one question: how likely are you to recommend us to a friend or colleague, on a scale of 0 to 10. Respondents split into promoters (9-10), passives (7-8), and detractors (0-6).
NPS = % promoters − % detractors (scores range from −100 to +100)
NPS is a leading indicator of renewals, expansion, and referrals, and an NPS above 50 is considered excellent in most industries. Its weakness is that the number alone tells you little about why, so the value comes from the open-ended follow-up. For a fuller picture of what NPS does and doesn't capture, see our guide to what NPS is and how it stacks up in NPS vs CSAT.
Customer satisfaction score (CSAT)
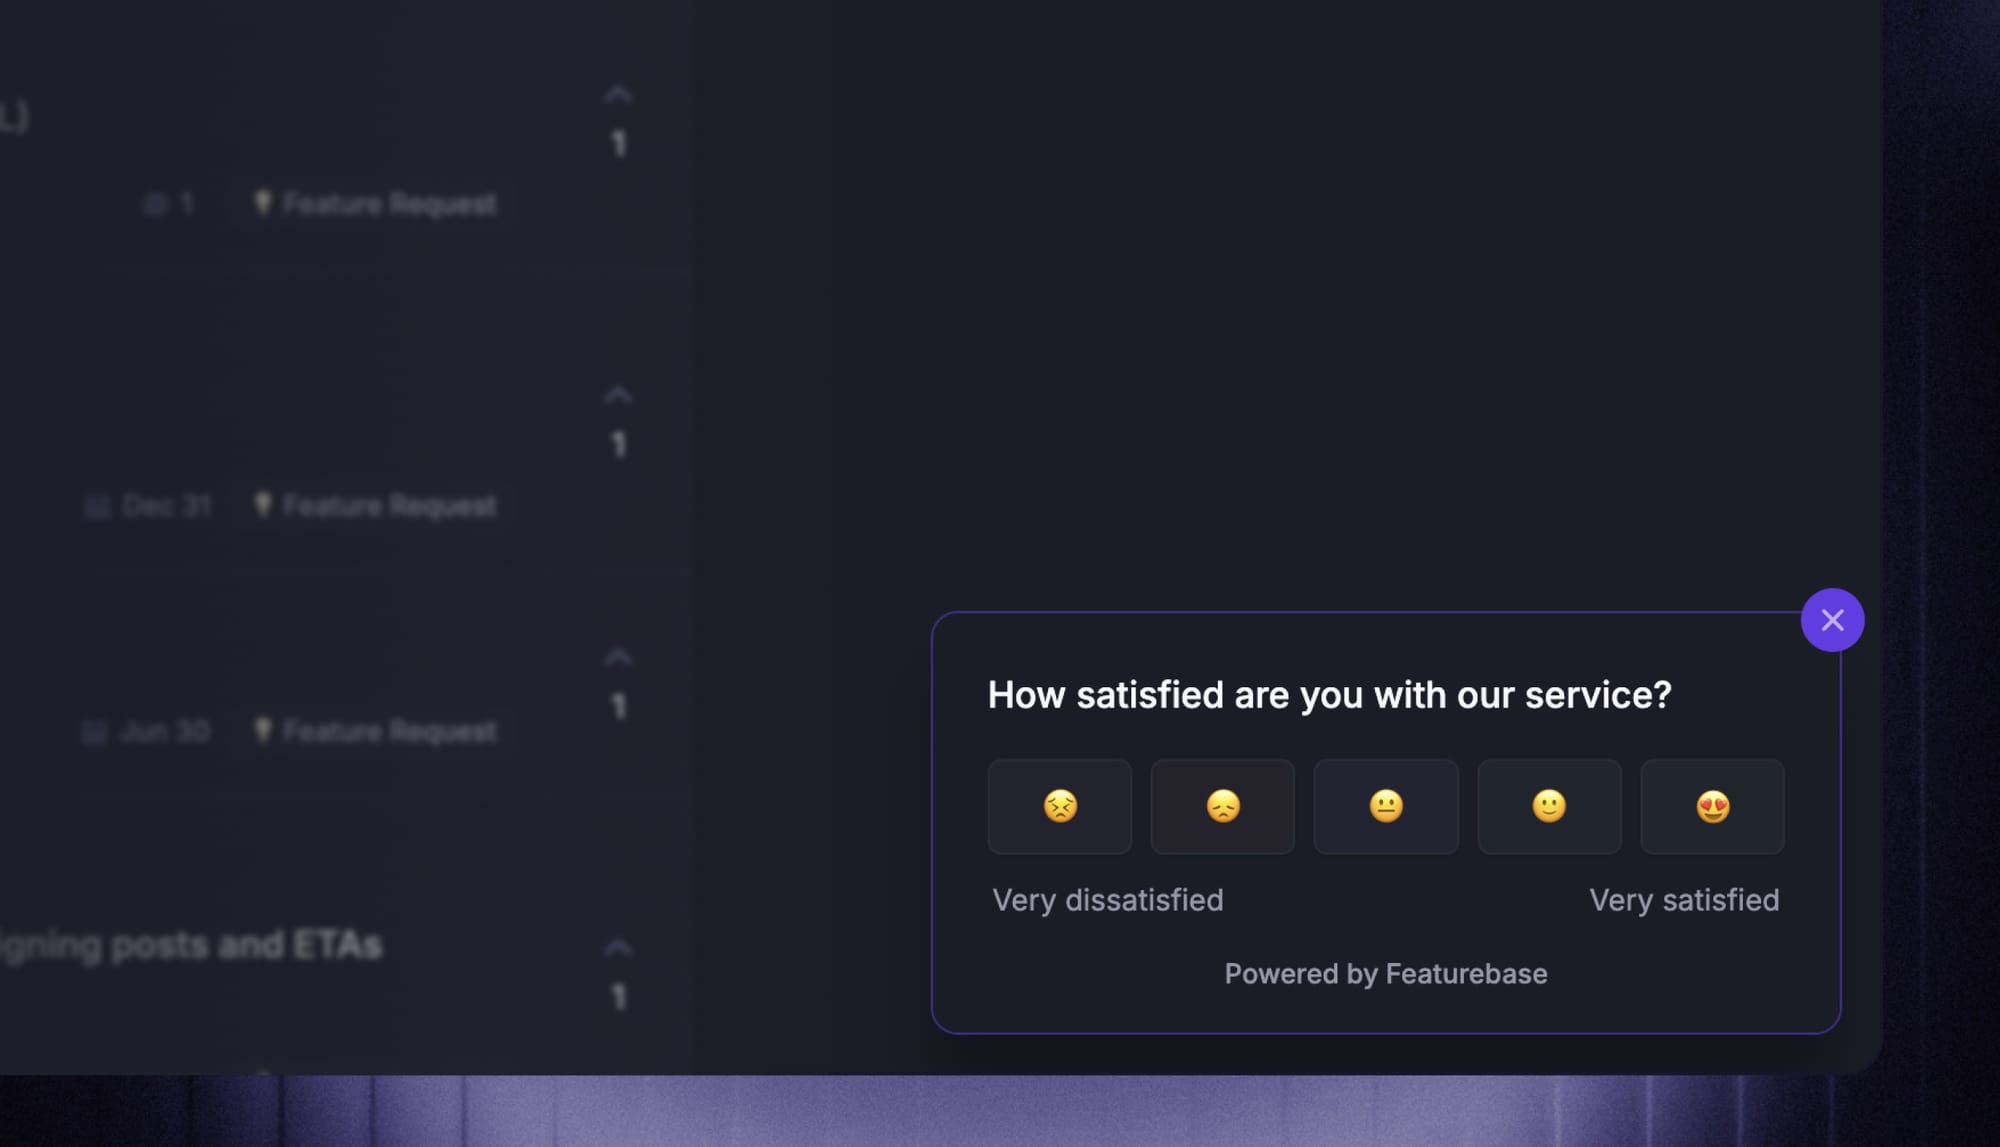
Customer satisfaction score captures how satisfied a customer is with a specific interaction, product, or experience, usually gathered right after a key moment like onboarding or a support resolution.
CSAT = (positive responses ÷ total responses) × 100
Where NPS measures long-term loyalty, CSAT is tactical: it tells you which specific processes work and which frustrate. A score above 75% to 80% is strong for most industries. Because it's tied to a moment, CSAT is best triggered immediately after the interaction you want to evaluate.
Customer effort score (CES)
Customer effort score measures how easy it was for a customer to get something done, whether that's resolving a support issue or completing a task in your product. The logic is simple: the more effort you demand, the more likely customers are to leave.
CES = average rating on a "how easy was it?" question (typically a 1-7 scale)
CES is often a stronger predictor of loyalty than satisfaction alone. In the landmark Harvard Business Review study behind the metric, 94% of customers who reported low-effort experiences said they would repurchase. High-effort interactions are a leading churn signal, so a falling CES is worth investigating fast.
All 3 of these sentiment metrics depend on actually collecting responses, which is where a lot of teams stall. With Featurebase surveys, you can run targeted in-app NPS, CSAT, and CES surveys, using rating scales and multi-step conditional questions so you capture not just the score but the reason behind it, without stitching together separate survey tools.
How to choose the right customer success metrics
You don't need all 12. The right set depends on your product, your customers, and your growth stage. A high-churn SMB product might lead with adoption rate, churn, and CSAT, while an enterprise business might prioritize NRR, health scores, and QBR outcomes.
A simple way to build your shortlist:
- Cover all 3 buckets: pick at least one revenue metric, one health or adoption metric, and one sentiment metric so no blind spot goes unwatched.
- Balance leading and lagging: lagging metrics like churn confirm what happened, while leading metrics like engagement and effort give you time to intervene.
- Tie each metric to an outcome: connect every number to protected revenue, expansion, or cost savings, so stakeholders see why it matters.
- Set shared targets: align sales, product, and support around the same KPIs so the whole company works toward the same customer reality.
Then wire the metrics into a dashboard your whole team can see, review them on a cadence that matches how fast each one moves, and close the customer feedback loop so insights actually turn into action.
Where the signals come from
A recurring theme across these metrics is that the hardest part isn't the math, it's gathering the raw customer signals in the first place. Revenue metrics live in your billing system, but health scores, NPS, CSAT, and effort scores all depend on actually asking customers and capturing what they say, consistently and in one place.
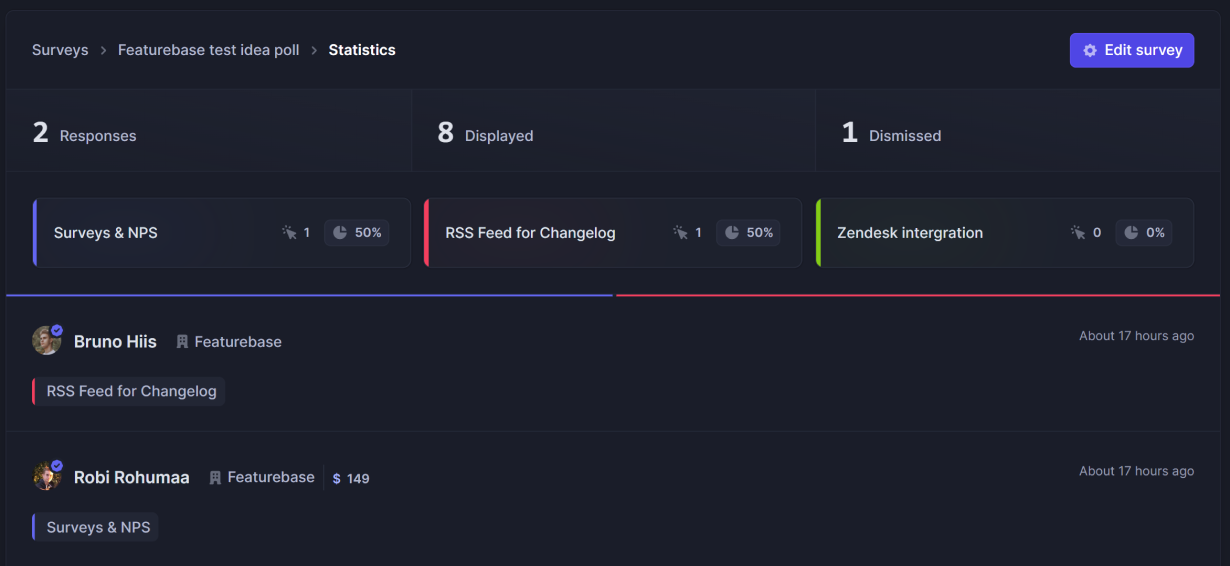
That's the gap a feedback platform fills. Featurebase, for example, lets you run in-app NPS, CSAT, and CES surveys, collect feature requests through a public feedback forum, and weight that feedback by customer revenue, so the qualitative inputs behind your metrics come from a single source rather than a scattered set of survey tools and spreadsheets. It has a free plan, so it's straightforward to test whether centralizing these signals sharpens your reporting.
Whatever you use, the principle holds: a metric is only as good as the signal feeding it, so it's worth investing in how you collect voice-of-customer data before worrying about the dashboard on top.
Conclusion
Customer success metrics only earn their keep when they change what you do. The 12 above give you a complete view, from the revenue metrics that prove impact to leadership, to the adoption and sentiment signals that warn you early. The goal isn't to track all of them, it's to choose the few that reflect your customers and act on them consistently.
Featurebase is a modern feedback platform that brings your surveys, feedback forum, and product updates into one place, so the NPS, CSAT, and voice-of-customer data behind your metrics come from a single source rather than a patchwork of tools. 💫
There's a free plan with unlimited feedback collection, so there's no downside to trying it. 👇
✨ Start collecting & managing feedback with Featurebase for free →
FAQs
What are the most important customer success metrics?
There's no single metric that captures everything, but if you had to pick one headline number, net revenue retention (NRR) is the strongest, because it combines retention, expansion, and contraction into a figure leadership already trusts. Beyond that, the best practice is to track a small set that spans revenue (NRR or churn), product health (adoption or health score), and sentiment (NPS or CSAT). The right mix depends on your business model and growth stage.
What's the difference between customer success and customer support metrics?
Customer success metrics measure outcomes over the whole relationship, such as retention, expansion, adoption, and lifetime value. Customer support metrics measure the efficiency and quality of individual interactions, such as first response time, resolution time, and ticket volume. They overlap (CSAT and effort score matter to both), but success metrics are about long-term value while support metrics are about handling requests well. You can see the support side in our guide to customer service metrics.
How often should you measure customer success metrics?
It depends on how fast each metric moves. Early-warning metrics like customer health score and churn risk are worth monitoring daily or in real time, while trend metrics like NPS and NRR are typically reviewed monthly or quarterly. CSAT is best measured continuously, right after each relevant interaction. Mixing these cadences prevents both data overload and blind spots.
What is a good net revenue retention rate?
Any NRR above 100% is healthy, because it means your existing customers are generating more revenue over time even before new sales. For private B2B SaaS, SaaS Capital's 2025 benchmarks put the median around 102% for mid-range ACVs, with top-quartile companies at 111% and best-in-class public SaaS often reaching 120% or more. Higher-priced, stickier products tend to post higher NRR.
What's the difference between leading and lagging customer success metrics?
Lagging metrics report what already happened, such as churn rate, renewal rate, and lifetime value. Leading metrics predict what's about to happen, such as product usage, engagement, effort score, and sentiment. The most effective programs pair the two, using leading indicators to intervene early and lagging indicators to confirm whether those interventions worked.
Can you automate customer success metric tracking?
Yes, and most teams should. Dedicated customer success platforms pull data from your CRM, product, and support tools to calculate metrics and trigger alerts automatically. For the sentiment side, tools like Featurebase can automate NPS, CSAT, and feedback collection with targeted in-app surveys, so the satisfaction signals feeding your metrics are gathered consistently rather than by hand.