Blog Customer FeedbackCustomer Success KPIs: 12 Metrics That Actually Matter
Customer Success KPIs: 12 Metrics That Actually Matter
The 12 customer success KPIs worth tracking, grouped by the question each one answers, with formulas and why each metric matters for your SaaS.

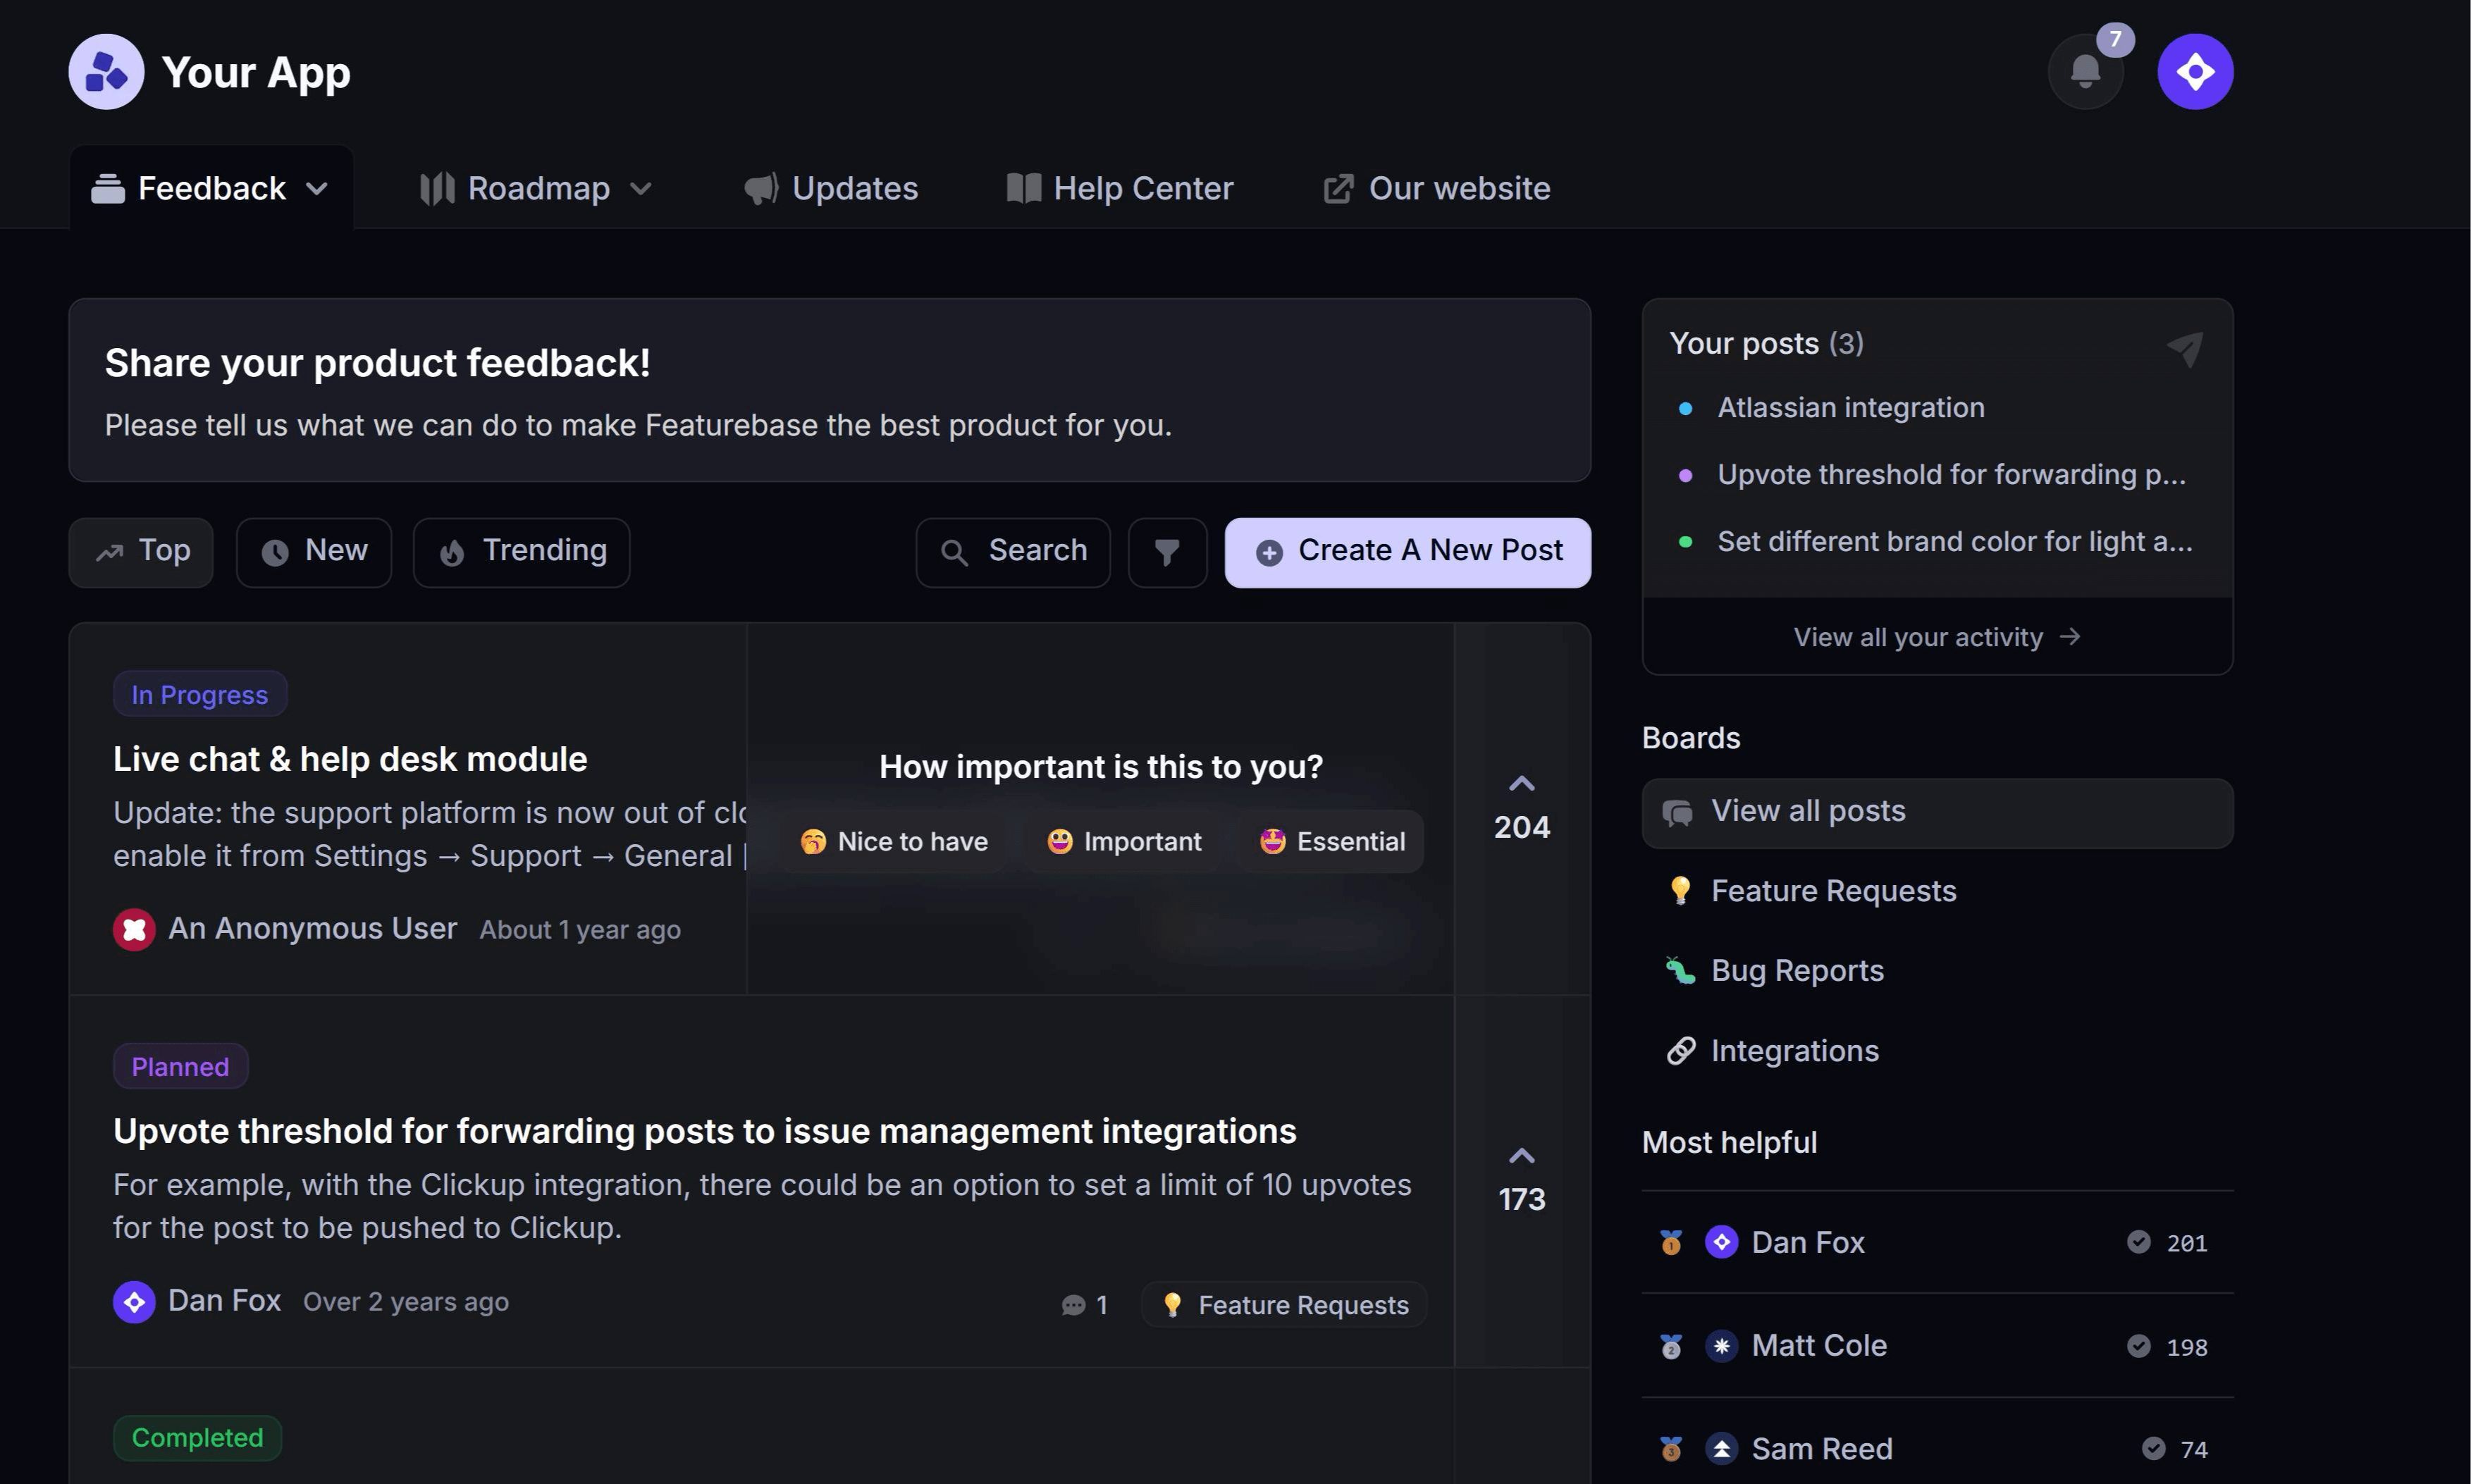

You can track 50 different numbers about your customers and still have no idea which ones are about to leave. That's the problem with customer success metrics: there are dozens, and most teams measure the ones that are easy to pull rather than the ones that predict what happens next.
This guide covers 12 customer success KPIs worth tracking, grouped by the 4 questions your team is actually trying to answer: are customers healthy, are they satisfied, are they staying and growing, and is support keeping up.
Here's each metric, how to calculate it, and why it matters 👇
Key takeaways:
- Customer success KPIs fall into 4 buckets: health and adoption, satisfaction and loyalty, retention and revenue, and support efficiency. Track at least one from each.
- Leading indicators like health score, product adoption, and time to value warn you before a customer churns. Lagging indicators like churn and net revenue retention confirm what already happened.
- The 3 metrics most SaaS teams can't skip are customer health score, net revenue retention, and churn rate.
- Don't track all 12. Pick the handful tied to your current goal, review leading indicators monthly, and review revenue metrics quarterly.
- Featurebase✨ lets you collect the NPS, CSAT, and feature feedback behind these KPIs with in-app surveys and a feedback portal, all in one place.
- A KPI only matters if it changes what you do. Pair every metric with an owner and an action threshold.
What are customer success KPIs?
Customer success KPIs are the metrics that tell you whether customers are getting real value from your product, and whether that value is translating into retention, expansion, and advocacy. They sit apart from vanity numbers because each one should trigger an action when it moves.
There's a useful distinction underneath all of them:
- Leading indicators predict what's about to happen: health score, product adoption, and time to value flag risk while you can still do something about it.
- Lagging indicators confirm what already happened: churn, net revenue retention, and renewal rate tell you the outcome after the fact.
A good KPI set balances both. Leading indicators give you time to intervene, and lagging indicators tell you whether the intervention worked.
The reason any of this matters comes down to economics. Retention compounds in a way acquisition never does. Bain & Company research popularized in Harvard Business Review found that increasing customer retention by just 5% can lift profits anywhere from 25% to 95%. Every KPI below is, in some way, a lens on that.
How to choose the right customer success KPIs
Tracking all 12 metrics at once is a fast way to track none of them well. The better approach is to pick a few that answer the questions your team is under pressure to answer right now.
Use the 4 categories as a checklist and pick at least one metric from each:
- Health and adoption: are customers actually using the product and getting value? Best for spotting risk early.
- Satisfaction and loyalty: how do customers feel about you, and will they recommend you? Best for catching sentiment problems.
- Retention and revenue: are customers staying and spending more? Best for proving CS impact to leadership.
- Support efficiency: is your team resolving issues quickly? Best for scaling without adding headcount.
Then match the cadence to the metric. Leading indicators like health score and adoption deserve a weekly or monthly look because they're actionable. Revenue metrics like net revenue retention and CLV are better reviewed quarterly, since they move slowly and reward strategic decisions over knee-jerk ones.
Customer health and adoption KPIs
These are your early-warning system. They move before the money does, which is exactly what makes them worth watching.
1. Customer health score
The customer health score is a composite metric that rolls product usage, engagement, support history, and sentiment into a single number, usually on a 0-100 scale or a red/yellow/green band. It's the most predictive KPI most CS teams have, because it flags risk before a renewal date arrives.
How to calculate it: there's no universal formula. Pick 3-5 signals that correlate with retention for your product (login frequency, depth of feature use, support ticket volume, NPS), weight them, and set thresholds. A common split is roughly 40% usage, 30% support health, 30% business outcomes, banded as green (80-100), yellow (50-79), and red (below 50).
Why it matters: it turns a scattered pile of data into one at-a-glance answer to "which accounts need attention this week?" Start simple with a handful of signals and refine the weights as you learn which ones actually predict churn.
2. Product adoption rate
Product adoption rate measures the percentage of users actively engaging with your product's key features, not just logging in. It's the difference between a customer who signed up and a customer who built your product into their workflow.
How to calculate it: divide the number of users who've engaged with a target feature by the total number of eligible users, then multiply by 100. Track both breadth (how many users adopt a feature) and depth (how often they use it).
Why it matters: high login rates can hide shallow usage. If customers never reach the features that deliver your core value, they're at risk the moment a simpler alternative shows up. Adoption tells you whether onboarding is actually landing.
3. Time to value (TTV)
Time to value measures how long it takes a new customer to reach their first meaningful outcome with your product. It's the clock running on the early period where impressions are formed and early churn is decided.
How to calculate it: define the "aha" milestone for your product (first campaign launched, first project shared, first deal logged), then measure the average time from signup to that moment. Segment by plan or customer size, since enterprise onboarding runs longer than self-serve.
Why it matters: a shorter TTV means customers see a return faster, which reduces early-stage churn and sets a positive tone for the whole relationship. It's also the cleanest measure of whether your onboarding is working.
Customer satisfaction and loyalty KPIs
These capture how customers feel, which usage data alone can't tell you. All 3 come from asking customers directly.
4. Net promoter score (NPS)
NPS measures loyalty by asking one question: "On a scale of 0-10, how likely are you to recommend us to a friend or colleague?" It's a standardized benchmark of overall sentiment and a rough predictor of growth through word of mouth.
How to calculate it: group respondents into promoters (9-10), passives (7-8), and detractors (0-6). Subtract the percentage of detractors from the percentage of promoters. The result runs from -100 to +100.
Why it matters: NPS is simple, comparable across time and competitors, and the open-ended follow-up ("why that score?") is where the real insight lives. If you're new to it, our guide to what NPS is and how to use it walks through the mechanics. Your biggest growth lever is usually converting passives into promoters, since they're already satisfied and only need a small nudge.
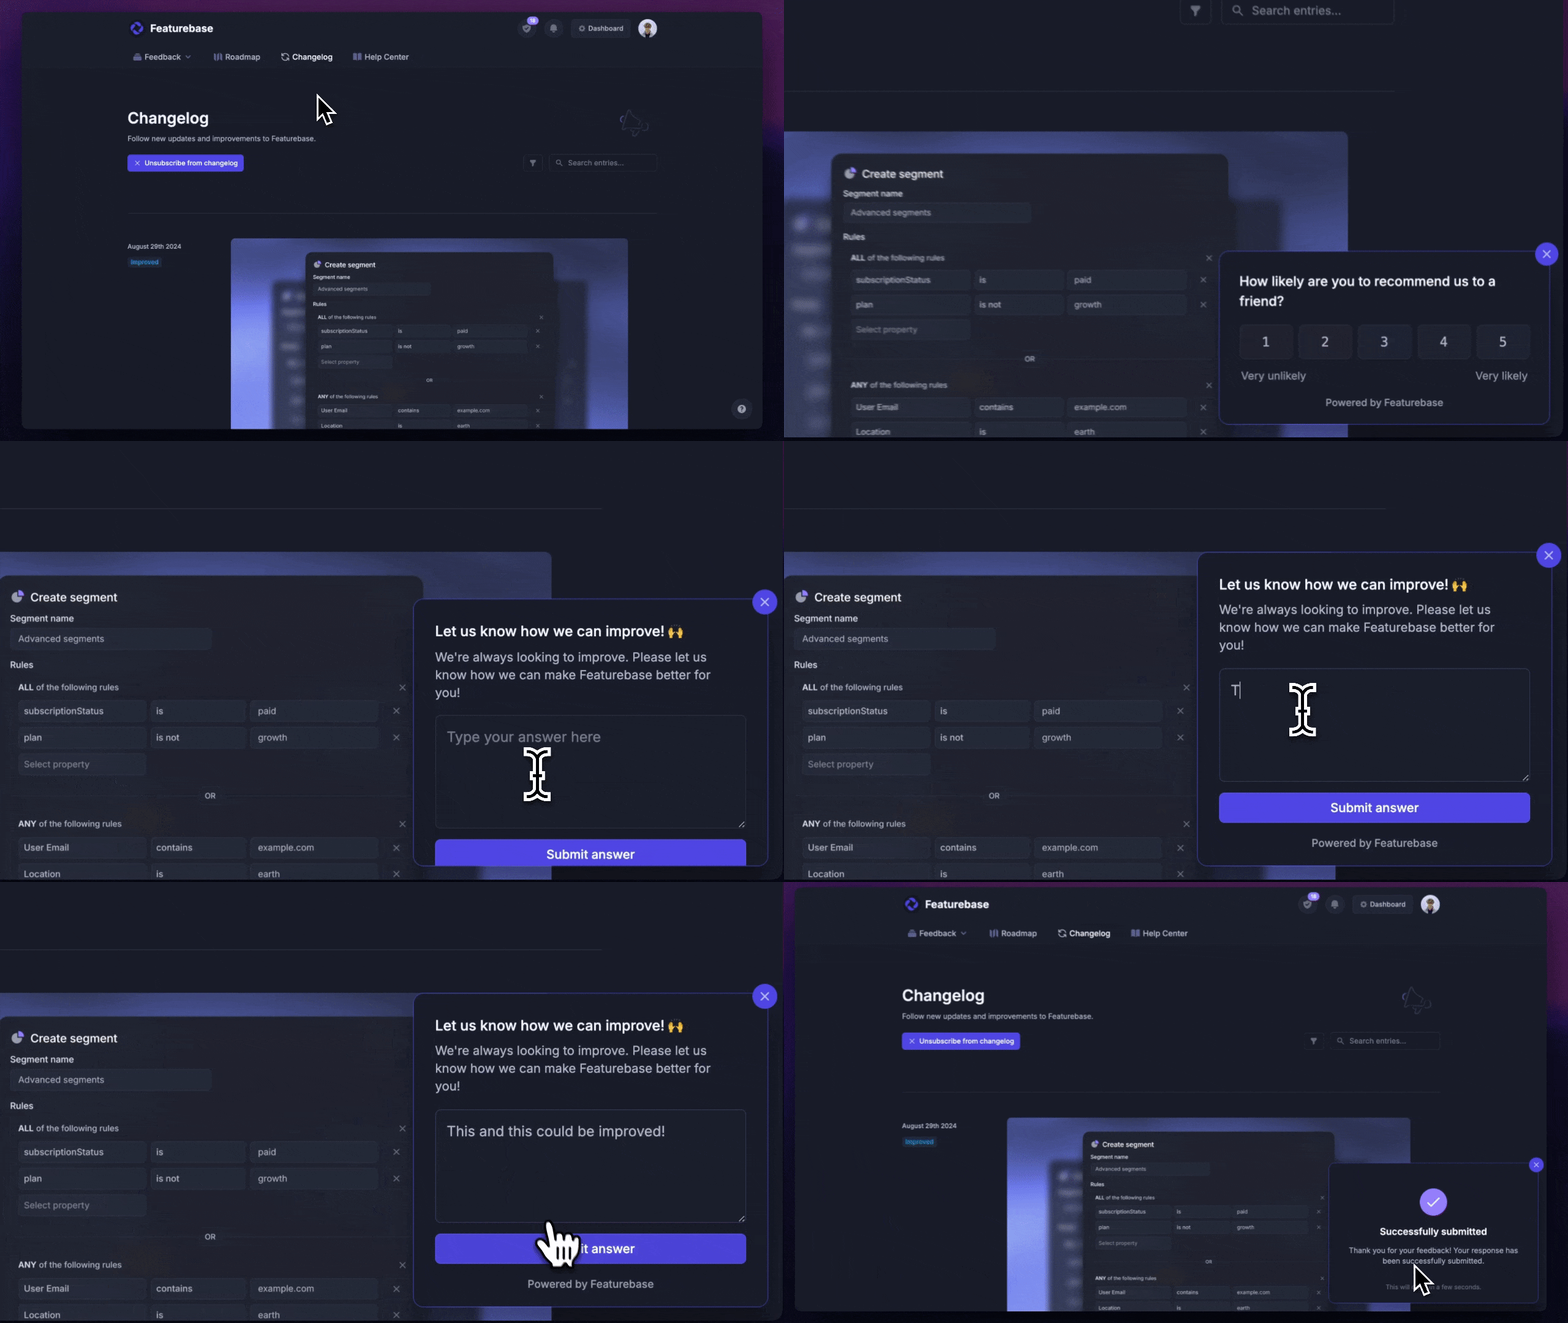
Collecting NPS shouldn't mean bolting on a separate survey tool. With Featurebase you can run targeted in-app NPS and CSAT surveys to the right user segment at the right moment, then route the responses alongside the rest of your feedback so the score comes with context instead of sitting in a silo.
5. Customer satisfaction score (CSAT)
CSAT measures happiness with a specific interaction, feature, or moment, usually by asking "How satisfied were you with your experience?" on a 1-5 scale. The two are easy to confuse, but NPS and CSAT differ in scope: NPS looks at the whole relationship, while CSAT is laser-focused on the here and now.
How to calculate it: divide the number of satisfied responses (typically 4s and 5s on a 5-point scale) by the total number of responses, then multiply by 100.
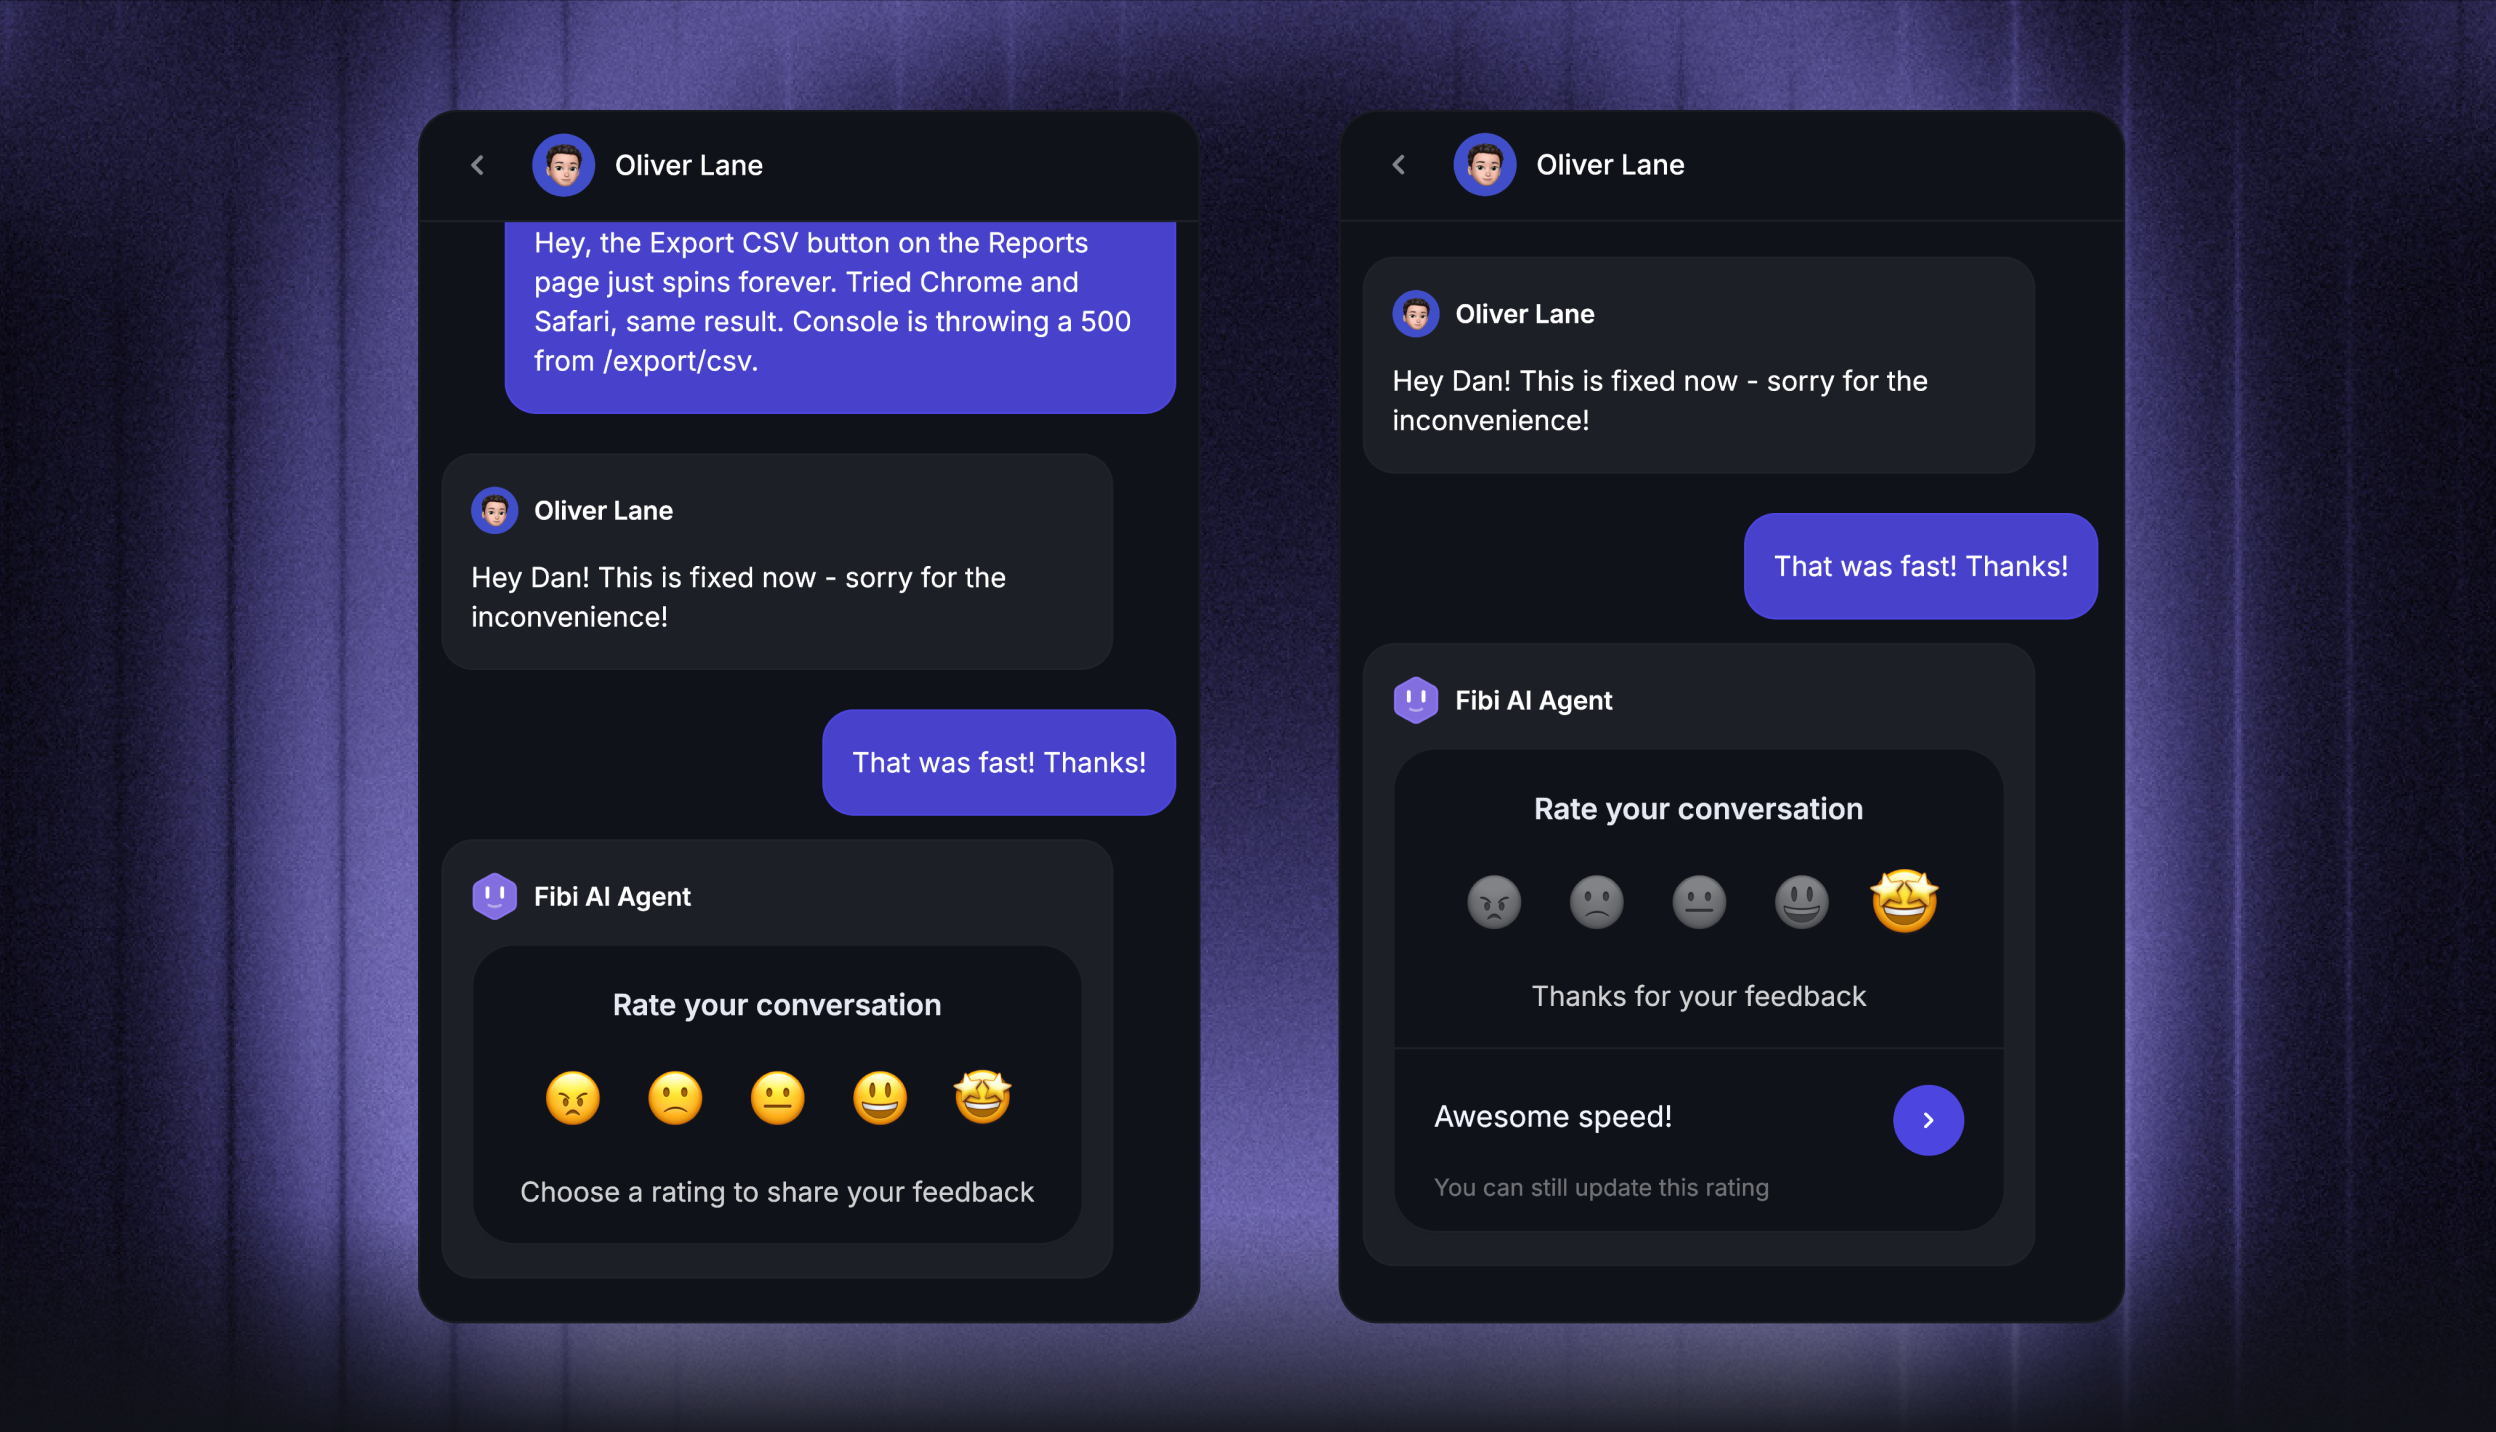
Why it matters: because it's transactional, CSAT pinpoints exactly which touchpoints create friction, whether that's a support resolution, an onboarding step, or a new feature. Trigger it immediately after the interaction while the experience is fresh, and keep it to a single question to protect response rates.
6. Customer effort score (CES)
CES measures how much work a customer had to do to get something done, whether that's resolving an issue, setting up the product, or completing a purchase. It's built on the finding that reducing effort drives loyalty more reliably than delighting customers does.
How to calculate it: ask customers to rate how easy an interaction was, usually on a 1-7 scale where 7 is "very easy." Average the scores, or take the percentage of responses at the top of the scale.
Why it matters: high-effort experiences quietly erode retention even when customers are otherwise satisfied. CES points you straight at the friction worth removing, and it pairs well with NPS for a fuller picture.
Customer retention and revenue KPIs
These are the customer success metrics leadership cares about, because they connect customer success directly to the bottom line.
7. Customer churn rate
Churn rate is the percentage of customers who stop using your product over a set period. It's the most direct, unfiltered measure of whether you're delivering on your value proposition, and the quintessential lagging indicator.
How to calculate it: divide the number of customers lost during a period by the total number of customers at the start of that period, then multiply by 100. Exclude customers acquired mid-period from the denominator.
Why it matters: high churn caps growth no matter how fast you acquire, because you're constantly refilling a leaky bucket. Segment it by plan, cohort, and acquisition channel to find the "why" behind the number, and track both customer churn and revenue churn, since losing one enterprise account isn't the same as losing one free-tier user.
8. Net revenue retention (NRR)
Net revenue retention measures how much recurring revenue you keep and grow from existing customers over a period, after accounting for expansion, downgrades, and churn. Cross 100% and your existing base is growing on its own, before you add a single new customer.
How to calculate it: NRR = (starting MRR + expansion MRR - contraction MRR - churned MRR) / starting MRR, expressed as a percentage.
Why it matters: NRR has become the metric investors and operators watch most closely. ChartMogul's analysis of over 2,500 SaaS businesses found that the median company with NRR above 100% grew more than twice as fast as companies below it (48% year-over-year versus roughly half that). Sustained expansion beats constant acquisition.
9. Customer lifetime value (CLV)
CLV estimates the total revenue you can expect from a single customer across the entire relationship. It reframes customers from one-off transactions into long-term assets, which changes how much you can justify spending to acquire and keep them.
How to calculate it: multiply average purchase value by purchase frequency by average customer lifespan. For SaaS, a simpler version is ARPA divided by churn rate, ideally adjusted for gross margin.
Why it matters: CLV tells you which segments are worth the most and how much you can invest in retention. When paired with customer acquisition cost, the CLV-to-CAC ratio is one of the clearest signals of whether your growth is sustainable.
10. Customer retention rate
Customer retention rate is the percentage of customers you keep over a period. It's the mirror image of churn, but framing it positively keeps teams focused on the customers who stay rather than only the ones who leave.
How to calculate it: take the number of customers at the end of a period, subtract any new customers acquired during it, divide by the number of customers at the start, then multiply by 100.
Why it matters: retaining an existing customer is far cheaper than winning a new one, and a high retention rate is a strong signal of product-market fit. It's also the foundation every expansion metric is built on.
Support efficiency KPIs
These tell you whether your team can keep customers happy as you scale, without support quality slipping.
11. First contact resolution (FCR)
First contact resolution is the percentage of support issues resolved in the first interaction, with no follow-ups or escalations. It overlaps with the customer service KPIs your support team tracks, but lands squarely in customer success, because slow, drawn-out resolutions are a quiet driver of churn.
How to calculate it: divide the number of issues resolved on first contact by the total number of issues, then multiply by 100. A common healthy benchmark sits around 75-85%.
Why it matters: customers value fast, clean resolutions, and every extra round of back-and-forth adds friction. A low FCR usually points to gaps in agent enablement, documentation, or the product itself.
12. Renewal rate
Renewal rate is the percentage of customers (or contracts) that renew when their term is up. For subscription businesses, it's one of the truest tests of whether customers got the value they expected.
How to calculate it: divide the number of customers who renewed by the number who were up for renewal, then multiply by 100. Track it monthly for SMB and quarterly for enterprise, where a healthy target sits above 90%.
Why it matters: activation and even satisfaction can look strong while renewals quietly slip. A high renewal rate confirms customers are seeing ongoing value, and a low one is an early warning that your onboarding promised more than the product delivered.
A quick note on collecting the data behind these KPIs
Several of the metrics above only work if you're actually hearing from customers. NPS, CSAT, and customer effort score all depend on surveys, and health and adoption scores get sharper when you know which features customers are asking for versus ignoring.
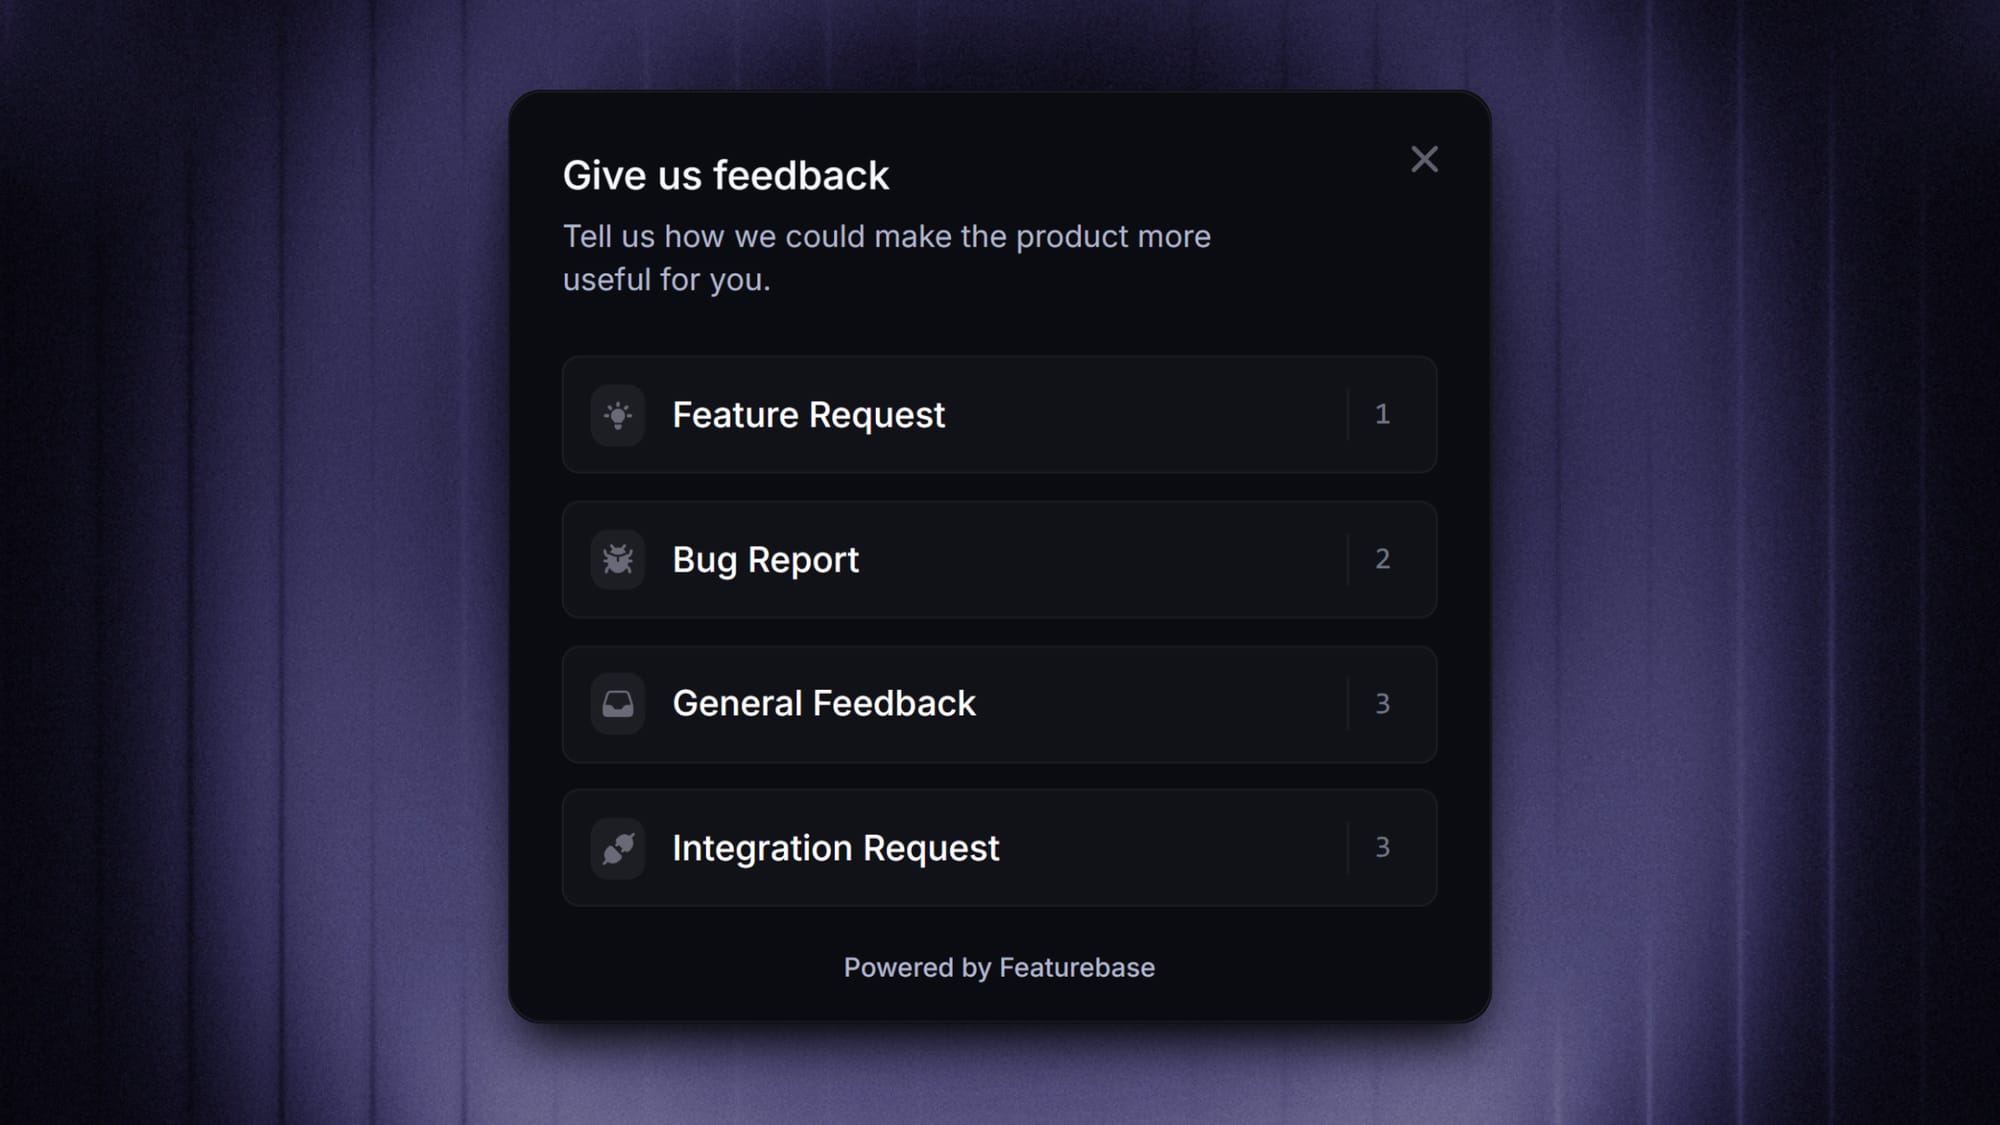
That's usually the harder part. The formulas are easy once the inputs exist, but the inputs tend to live in scattered places: a survey tool here, a spreadsheet of feature requests there, support tickets somewhere else.
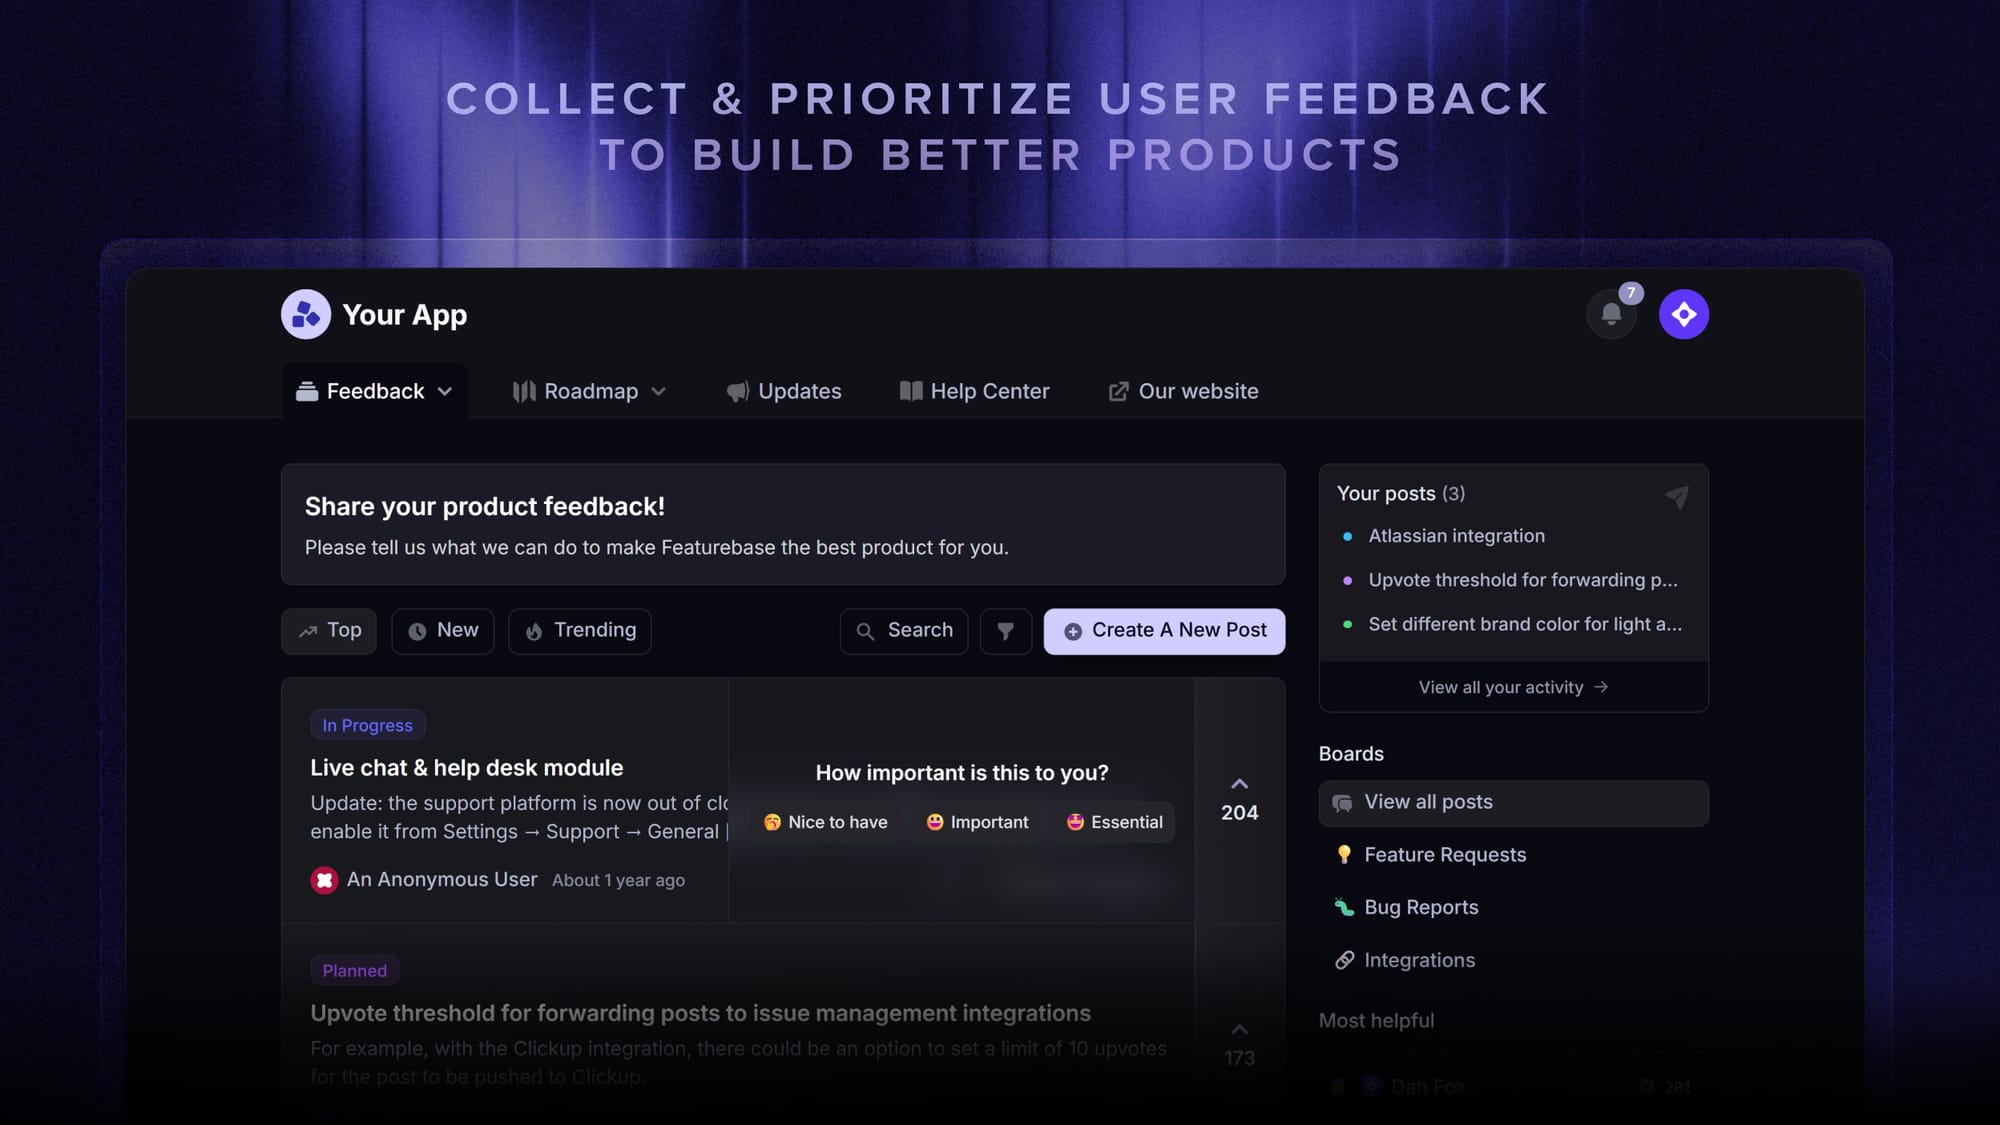
This is the gap Featurebase is built to close. It runs targeted in-app NPS and CSAT surveys, collects feature requests in a forum customers can vote on, and lets you weight that feedback by account revenue, so the satisfaction and adoption signals feeding your KPIs sit in one place with context attached rather than scattered across the voice-of-customer tools you'd otherwise stitch together. There's a free plan if you want to see whether it fits your setup.
Conclusion
The point of customer success KPIs isn't to build the biggest dashboard. It's to answer, at any moment, whether your customers are healthy, satisfied, staying, and well supported, and to know what to do when the answer is no.
Pick one metric from each of the 4 categories, give each an owner and a threshold that triggers action, and review them on a cadence that matches how fast they move. That beats tracking all 12 and acting on none.
If part of the challenge is collecting the feedback behind those numbers, Featurebase brings your surveys, feature requests, roadmaps, and product updates into a single platform, so the voice-of-customer side of your KPIs lives in one place instead of five. There's a free plan with unlimited feedback collection and onboarding is quick, so there's no downside to trying it 👇
✨ Start collecting & managing feedback with Featurebase for free →
FAQs
What are the most important customer success KPIs?
For most SaaS teams, the 3 that matter most are customer health score, net revenue retention, and churn rate. Health score warns you early, churn confirms what happened, and net revenue retention ties the whole thing to revenue. Add NPS or CSAT when you need to understand the sentiment behind the numbers.
What is the difference between customer success metrics and KPIs?
Metrics are any measures you can track, while KPIs are the specific few you've chosen because they tie directly to a goal. Every KPI is a metric, but not every metric earns KPI status. The distinction matters because treating everything as a KPI dilutes focus and leads to dashboards nobody acts on.
How do you measure customer success?
Combine a leading indicator, a satisfaction signal, and a retention or revenue metric so you see risk, sentiment, and outcome together. For example, pair customer health score with CSAT and net revenue retention. No single number captures customer success on its own, which is why balanced coverage across the categories beats obsessing over one metric.
What is a good customer health score?
There's no universal number, because a health score is only meaningful relative to your own product and churn patterns. What matters is that the score reliably predicts which customers renew versus churn, and that you've set clear bands (green, yellow, red) tied to specific actions. Start with a few signals, validate them against real outcomes, and refine the weights over time.
How often should you review customer success KPIs?
Match the cadence to how fast the metric moves and how actionable it is. Review leading indicators like health score and product adoption weekly or monthly, since you can act on them quickly. Review revenue metrics like net revenue retention, CLV, and renewal rate quarterly, since they reward strategic decisions over reactive ones.
What's the best way to collect the NPS and CSAT feedback behind these KPIs?
The most reliable approach is targeted in-app surveys triggered close to the relevant moment, so you capture sentiment while the experience is fresh and response rates stay high. Featurebase lets you run NPS and CSAT surveys to specific user segments and keep the responses alongside your other feedback, so each score comes with the context to act on it rather than sitting in isolation.