Blog Customer FeedbackChurn Rate vs Retention Rate: Formulas and Examples
Churn Rate vs Retention Rate: Formulas and Examples
Understand churn rate vs retention rate with clear formulas, worked examples, and practical ways to measure customer losses and improve SaaS retention.


Churn rate measures the customers you lose. Retention rate measures the customers you keep. Simple enough, until new signups make your customer count look healthy while existing customers quietly leave.
The difference matters because growth and retention answer different questions. You can grow your customer base and still have a churn problem.
In this guide, I'll walk through both formulas, show how they work with the same customers, and explain what to do with the results. 👇
Key takeaways
- Churn looks at losses: Customer churn rate measures the share of your starting customers who leave during a defined period.
- Retention looks at staying power: Customer retention rate measures the share of that starting group still with you at the end.
- Compare like with like: The rates add up to 100% when the customer group, period, and counting rules match.
- Revenue tells a different story: Upgrades can increase revenue from existing customers even while some accounts leave.
- Featurebase✨ brings feedback from support conversations, customer calls, and your portal together to help you investigate the problems behind your retention numbers.
Churn rate vs retention rate: What's the difference?
Customer churn rate is the percentage of existing customers you lose during a specific period. Customer retention rate is the percentage you keep. Both measure what happens to customers you already had, rather than how many new customers you acquire.
For a subscription business, you might count an account as churned when its paid subscription ends. For a product usage report, you might measure whether users return and complete a meaningful action.
Those definitions serve different purposes. An inactive user can still belong to a paying account, so label the metric before interpreting it.
| Comparison | Customer churn rate | Customer retention rate |
|---|---|---|
| Main question | How many existing customers did we lose? | How many existing customers stayed? |
| Numerator | Starting customers lost | Starting customers retained |
| Denominator | Customers at the start | Customers at the start |
| Desired direction | Lower | Higher |
| Useful for | Investigating cancellations and losses | Comparing how well customer groups stay |
Neither number explains why a customer left. Think of them as the starting point for investigation, then combine them with usage data, support conversations, and customer feedback.
How to calculate churn rate and retention rate
Start with a defined period and a list of the customers active at its beginning. For B2B SaaS, count customer accounts consistently, rather than mixing accounts with individual users or subscriptions.
Churn rate formula
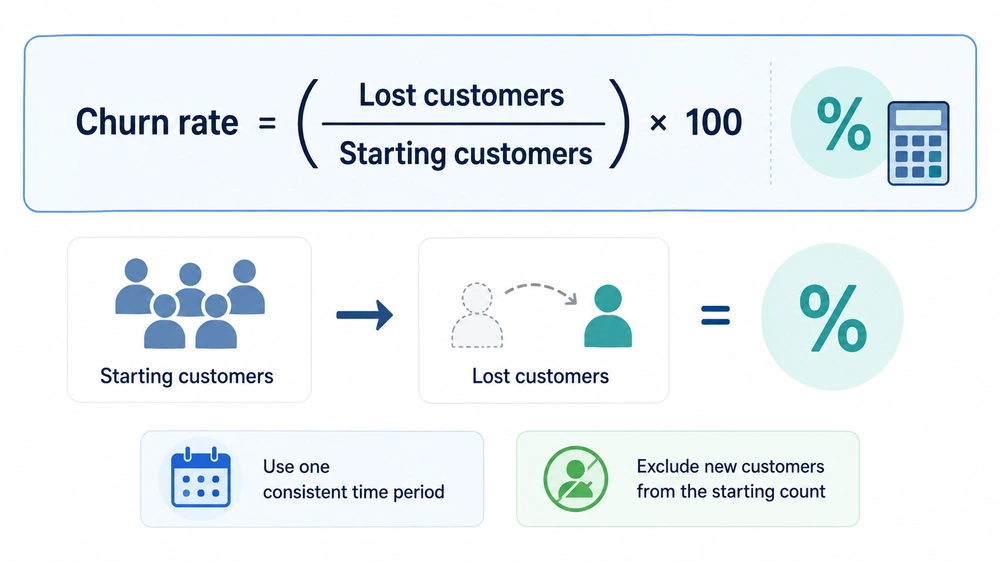
To calculate your customer churn rate, divide the customers lost from the starting group by the size of that group:
Customer churn rate = (Starting customers lost ÷ Customers at the start) × 100
Decide when a cancellation becomes a loss. If someone cancels renewal today but keeps paid access until next month, counting the loss immediately produces a different report from counting it at subscription expiry.
Retention rate formula
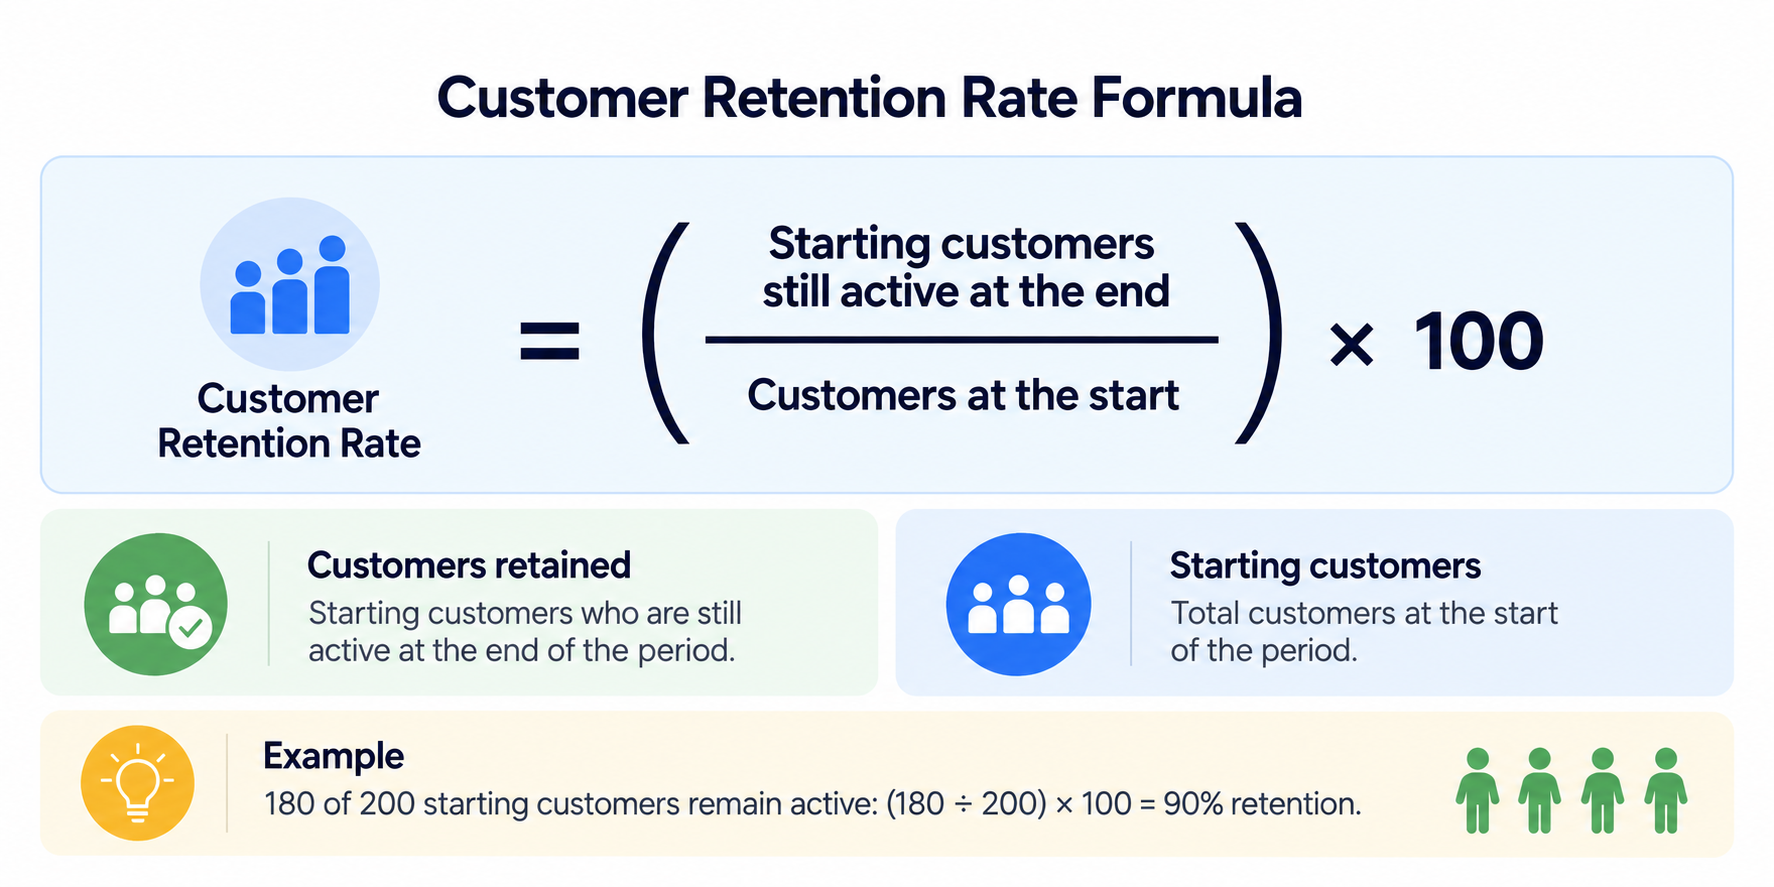
The most direct customer retention rate formula follows the same starting customers:
Customer retention rate = (Starting customers still active at the end ÷ Customers at the start) × 100
You'll also see the shortcut ((End customers − New customers) ÷ Start customers) × 100. It works when subtracting new customers leaves exactly the retained starting group. Customers who join and leave within the period, or older accounts that reactivate, need separate treatment.
A worked example using the same customers
Imagine your SaaS starts April with 500 paying customer accounts. During April, 25 of those accounts leave, while 75 new accounts join and remain active through month-end. No accounts reactivate.
| Customer movement | Accounts |
|---|---|
| Customers at the start | 500 |
| Starting customers lost | 25 |
| Starting customers retained | 475 |
| New customers still active | 75 |
| Total customers at the end | 550 |
Your calculations are:
- Churn rate: 25 ÷ 500 × 100 = 5%.
- Retention rate: 475 ÷ 500 × 100 = 95%.
The shortcut gives the same answer: (550 − 75) ÷ 500 × 100 = 95%.
Your customer base grew from 500 to 550, but you still lost 5% of the original customers. Using the total ending count alone would hide that loss.
When do churn and retention add up to 100%?
Retention rate = 100% − churn rate when each customer in the same starting group is counted once as either retained or lost.
Keep the customer group and time period consistent
Use the same reporting window and definition for both metrics. Monthly customer churn cannot be paired with annual retention, and paid-account churn cannot be paired with a report about weekly active users.
Returning customers also need a consistent rule. If a starting customer cancels and reactivates before month-end, a cancellation-event report may record a loss while an end-of-period report counts that customer as retained. Those reports won't necessarily complement each other.
Exclude new customers from the retained customer count
Track acquisition separately from retention. A new customer wasn't part of your starting group, so they cannot replace a lost customer in that group's retention calculation.
For example, if 10 of April's 75 new accounts also left before month-end, the ending count would be 540. The original 475 retained accounts would still represent 95% retention, but subtracting all 75 signups from 540 would incorrectly produce 93%.
Following customer IDs avoids this shortcut problem. Report losses among newly acquired customers separately, so their early experience remains visible too.
Customer retention vs revenue retention
Customer retention counts accounts. Revenue retention measures how much recurring revenue you keep from existing accounts, which matters when customers spend different amounts.
Losing a small account and losing your largest customer each count as 1 customer loss. Their financial impact can be very different.
Gross revenue retention
Gross revenue retention (GRR) measures recurring revenue retained after cancellations and downgrades, excluding expansion. Using monthly recurring revenue (MRR):
GRR = ((Starting MRR − Churned MRR − Downgrade MRR) ÷ Starting MRR) × 100
Imagine an existing customer group generates $20,000 in MRR. It loses $1,000 from cancellations and $500 from downgrades during the month.
GRR is ($20,000 − $1,000 − $500) ÷ $20,000 × 100 = 92.5%. Gross revenue churn is the complementary 7.5%.
Net revenue retention
Net revenue retention, or NRR, includes expansion from those existing customers, such as upgrades or additional seats:
NRR = ((Starting MRR − Churned MRR − Downgrade MRR + Expansion MRR) ÷ Starting MRR) × 100
If the same group adds $2,500 in expansion MRR, NRR becomes ($20,000 − $1,000 − $500 + $2,500) ÷ $20,000 × 100 = 105%.
That means existing-customer revenue grew despite the losses. It doesn't mean every customer stayed. Net revenue churn would be −5%, sometimes called negative churn, while customer churn would still reflect lost accounts.
Exclude revenue from newly acquired customers in both calculations. Otherwise, sales growth can mask problems in your existing customer base.
What is a good churn or retention rate?
There isn't a useful universal target without knowing the metric, time period, and business model. A monthly consumer subscription and an annual enterprise contract have different renewal opportunities and buying behavior.
Before using a benchmark, match these factors:
- Metric: Customer retention, gross revenue retention, or net revenue retention.
- Period: Monthly, quarterly, or annual measurement.
- Customer profile: Similar spending levels, company sizes, and use cases.
- Billing model: Monthly versus annual commitments.
For context, ChartMogul's 2025 billing report, using 2024 data, found median NRR of 88% for annual plans versus 76% for monthly plans in the $250–$500 average revenue per account segment. Its ARPA comparisons exclude companies below $300,000 ARR and companies using only one billing model.
These are revenue retention benchmarks, not customer retention targets. The comparison shows an association with billing structure, not proof that switching contracts will fix retention.
Start by comparing your own customer groups over time. A cohort is a group with a shared characteristic, such as signup month. Comparing successive cohorts at the same age helps show whether newer customers are staying longer.
5 ways to reduce churn and improve retention
Once your numbers are consistent, connect them to a specific problem you can investigate. Useful customer retention management starts with understanding which customers leave and what happened before they did.
1. Find where customers stop getting value
Break churn down by signup cohort, plan, acquisition channel, or customer type. Then inspect what affected accounts did before leaving.
Customers disappearing before their first successful project suggest a different problem from long-term customers leaving after a pricing change. Separate voluntary cancellations from involuntary churn caused by failed payments, too. Billing recovery and product improvements address different causes.
2. Ask customers about specific friction
Usage data can show where people stop. Feedback helps you understand what prevented them from continuing.
Ask focused customer feedback questions, such as “What stopped you from completing your first project?” or “What did you need this feature to do?” Review responses alongside the customer's actual experience.
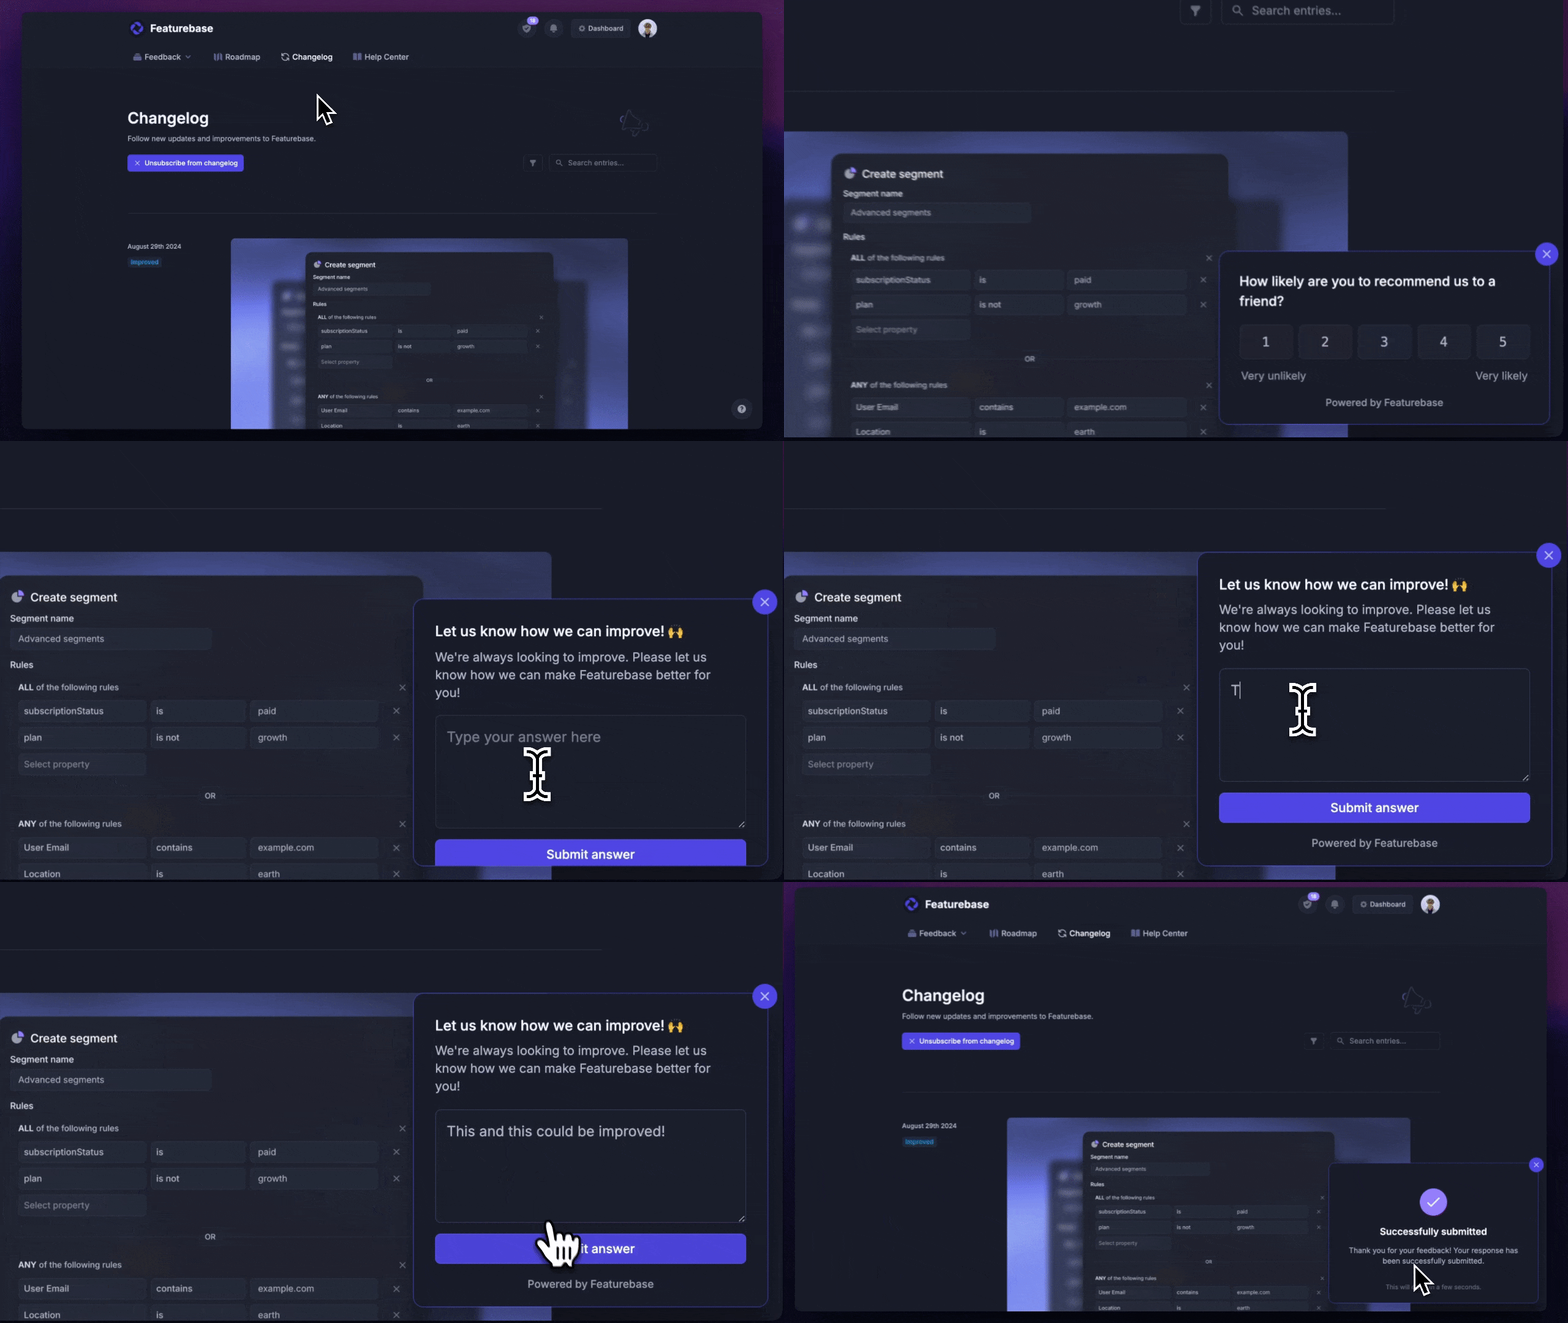
Featurebase Surveys let you collect targeted feedback inside your web app, including follow-up questions based on answers. That gives your team context for an onboarding or feature problem while the experience is still fresh.
3. Improve onboarding around the first useful outcome
Design customer onboarding around something the customer wants to accomplish. For a reporting product, that might be generating a useful report from their own data.
Remove unnecessary steps before that outcome and offer help where people get stuck. Completing a product tour isn't enough if the customer still can't do the job they signed up for.
4. Address recurring product and support problems
Group cancellation reasons, bug reports, and support issues into themes. Prioritize problems using their severity, the customers affected, and the effort required to fix them.
A repeated export failure may deserve attention before a popular cosmetic request. Check the underlying conversations before assuming a feature request explains churn.
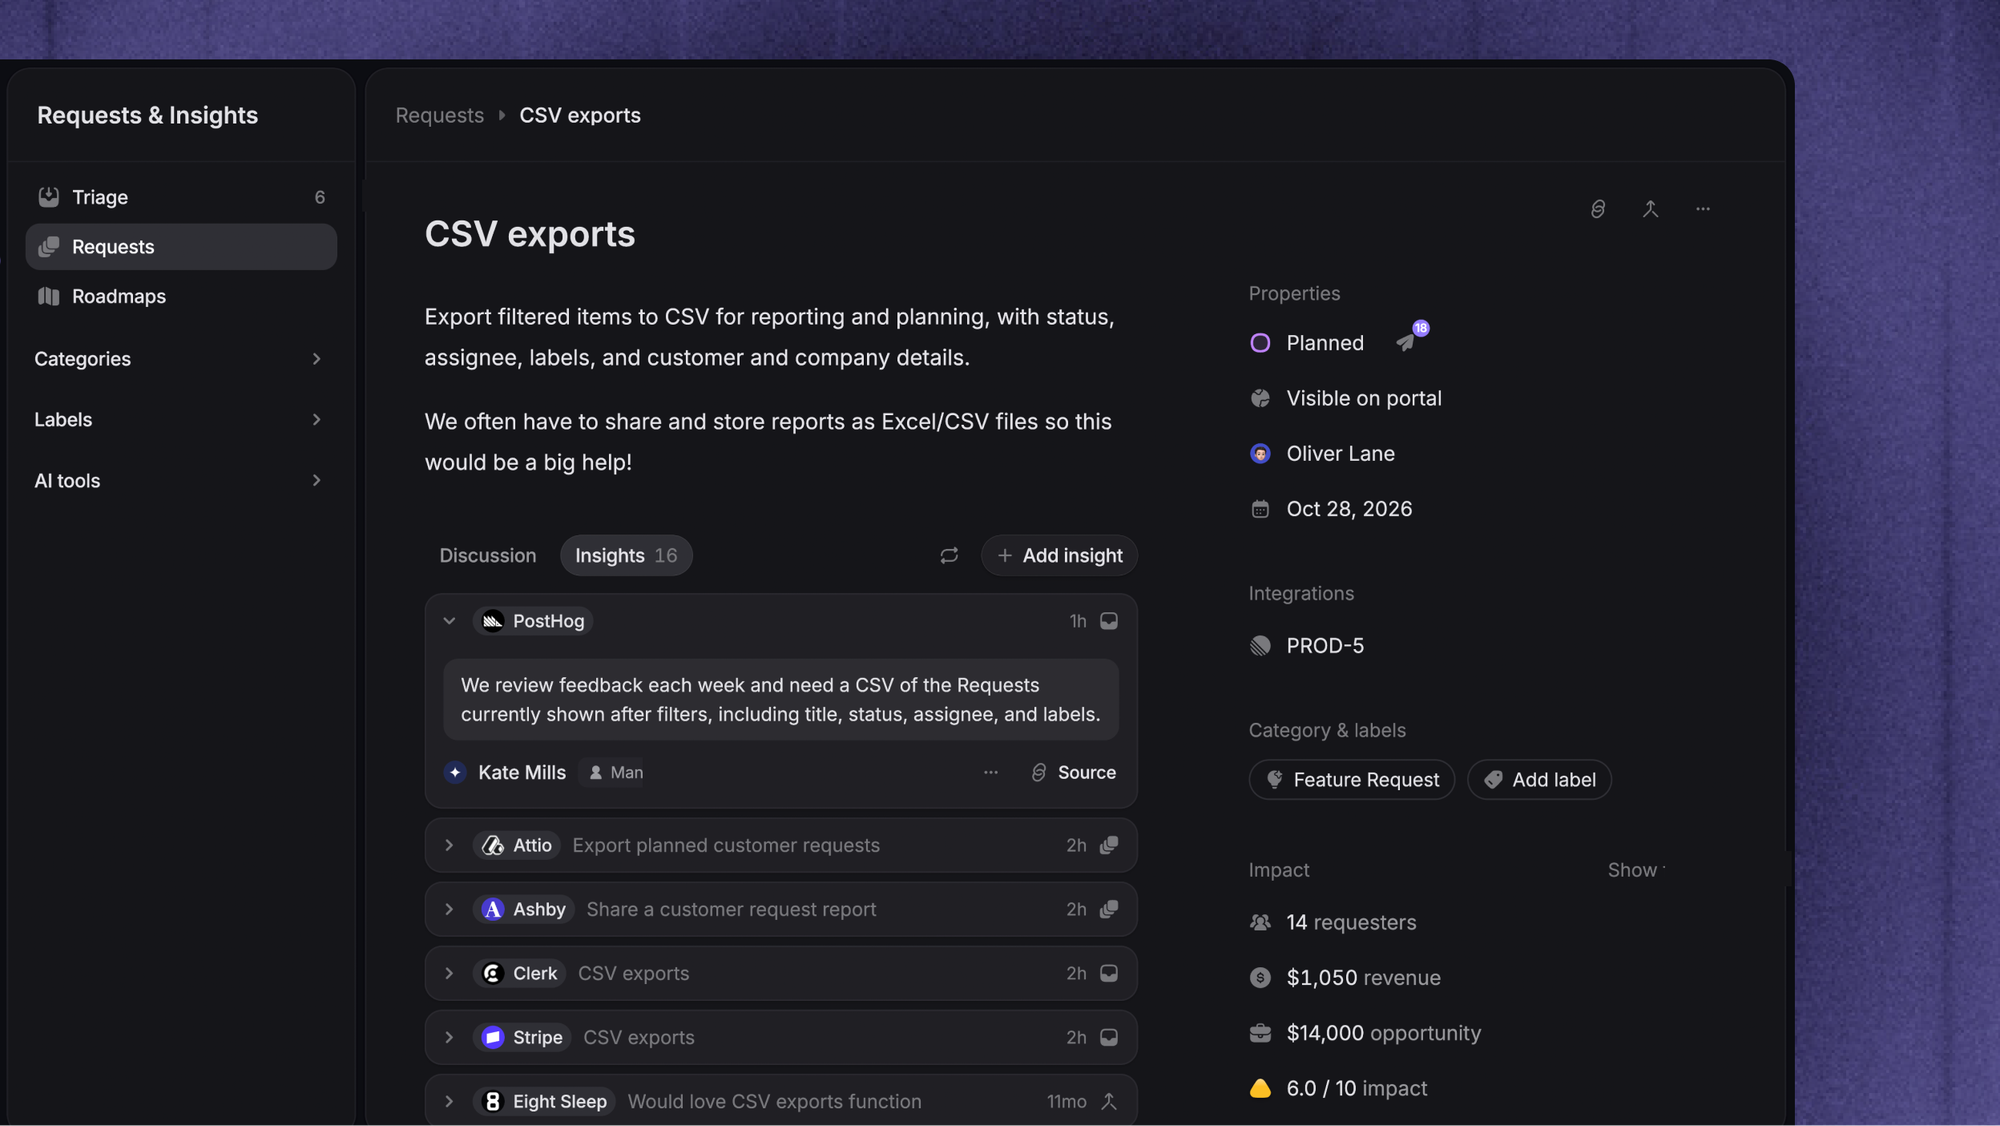
Featurebase brings related feedback together as Requests, with individual pieces of customer evidence attached as Insights. AI Autopilot helps organize incoming feedback, link relevant Insights, and handle duplicate Requests, while uncertain matches go to Triage for review. This helps your team assess recurring needs alongside the customers and companies behind them.
5. Follow up and measure the result
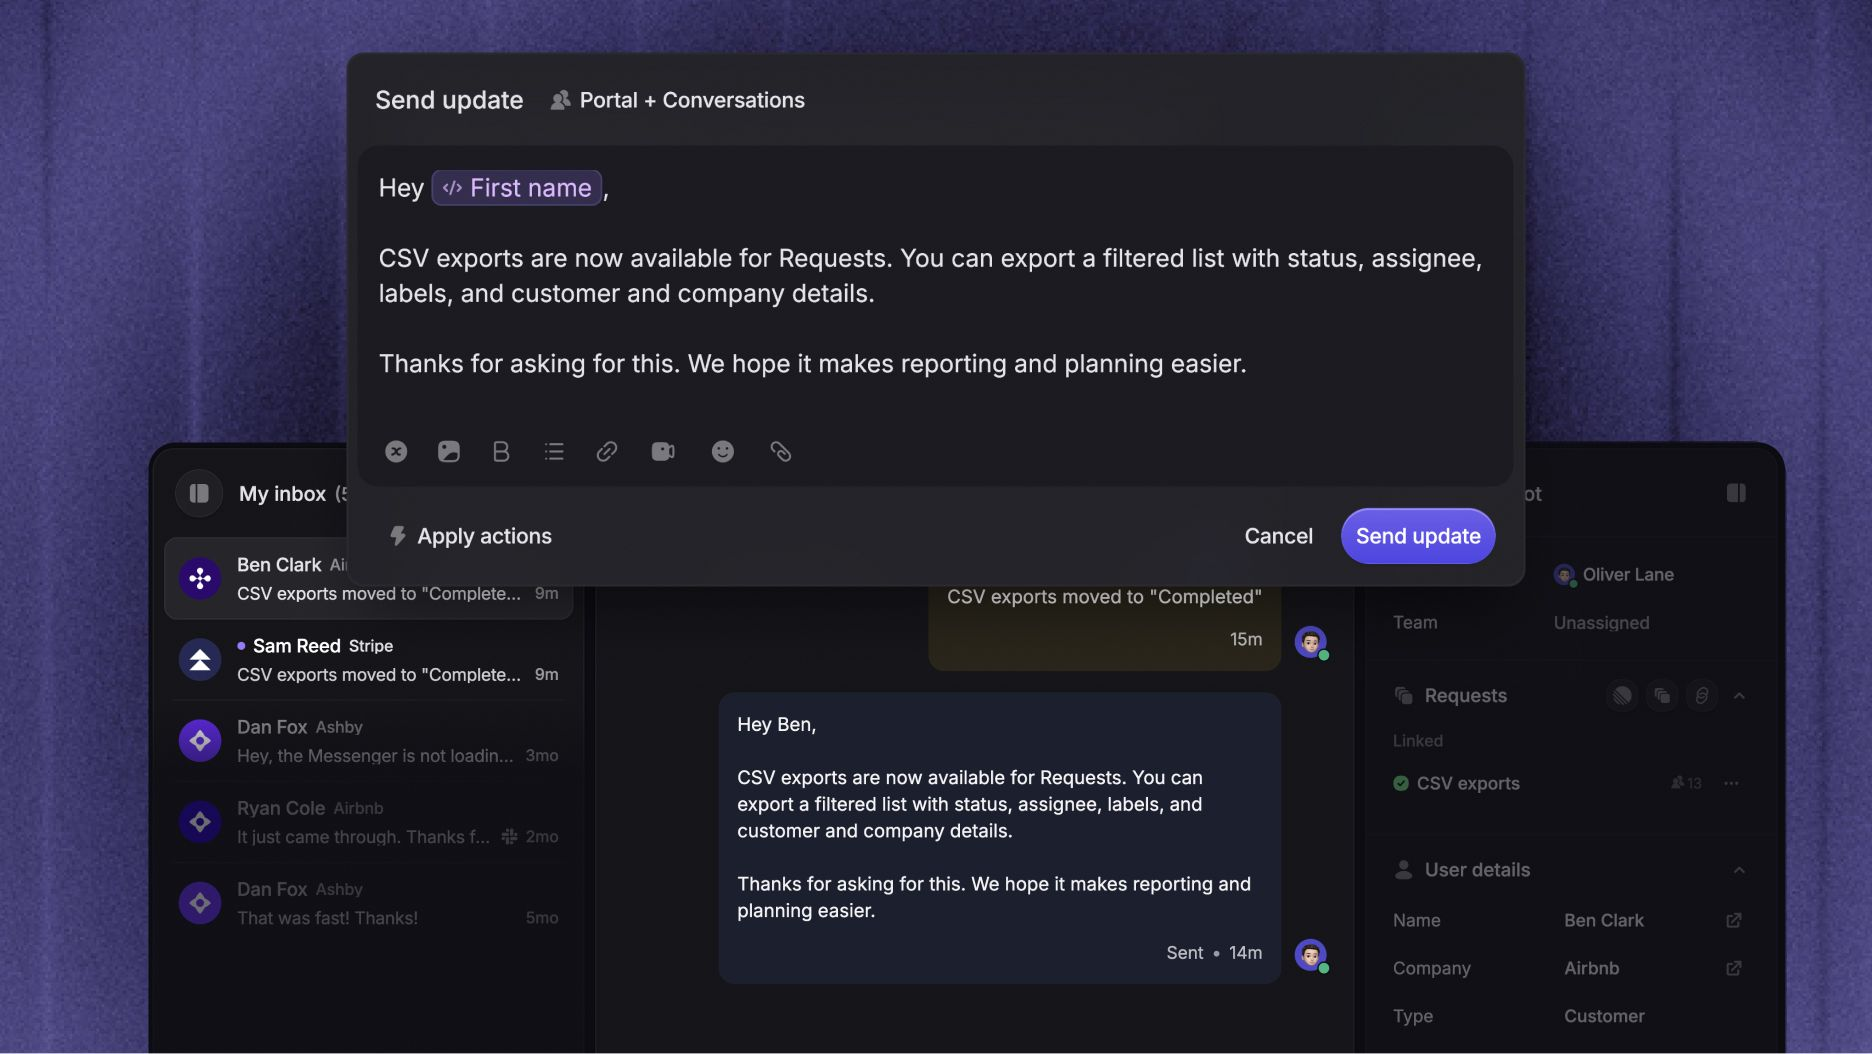
Close the customer feedback loop by telling affected customers when you resolve their problem. Explain what changed and help them try the improved workflow.
Then compare retention for similar customer groups over a complete reporting window. Record the change and when it shipped, so you can judge whether the result supports continuing, adjusting, or reversing it.
Conclusion
Churn and retention describe losses and continuity within your existing customer base. Keep their definitions consistent, track revenue separately, and use feedback to investigate what the numbers can't explain.
Featurebase is an AI-powered feedback & support platform that connects customer feedback with the evidence behind it. AI Autopilot helps organize feedback from support conversations, connected call recorders, and your portal into Requests backed by Insights. Your team can prioritize with customer context and send Request updates back to linked support conversations to close the loop.
It comes with a Free plan, and you can get started without a credit card. 👇
✨ Start collecting & managing feedback with Featurebase for free →
FAQs
How do you convert monthly churn into annual churn?
With a constant monthly churn rate and no reactivations, annual churn is 1 − (1 − monthly churn)^12, using decimals. For example, 2% monthly churn gives 1 − 0.98^12, or approximately 21.5% annual churn. This is a projection under fixed assumptions, rather than a substitute for measuring your actual annual cohort.
Is customer attrition the same as churn?
Customer attrition and customer churn generally describe the loss of customers. Outside subscription businesses, you need a clear inactivity threshold to decide when someone has left, because there may be no cancellation event.
How does churn affect customer lifetime value?
When customers leave sooner, they have less time to generate revenue and margin, which can reduce customer lifetime value. This also leaves less time to recover customer acquisition costs. Estimate lifetime value using the behavior and economics of comparable customer groups, rather than assuming every customer has the same lifespan.
Does a high satisfaction score guarantee retention?
No, satisfied customers can still leave because their budget, priorities, or needs change. Survey respondents may also differ from customers who never answer. Pair satisfaction scores with actual renewal and usage behavior before drawing conclusions.
How is renewal rate different from retention rate?
Renewal rate focuses on contracts or revenue eligible to renew during a particular period. Retention follows the customer base or revenue present at the start of the period, including accounts whose renewal dates fall later. Use the eligible renewal group as the denominator when measuring renewals.