Blog Customer ServiceCustomer Service Metrics: 10 KPIs Worth Tracking
Customer Service Metrics: 10 KPIs Worth Tracking
Customer service metrics tell you whether support is actually improving. Here are the 10 KPIs worth tracking, with a formula and a realistic benchmark for each.


Your support dashboard can show you dozens of numbers and still leave you guessing whether service is getting better. The problem is rarely too little data. It's tracking the wrong things, or too many at once.
The fix is knowing which metrics map to how your team actually works, what each one tells you, and what a good score looks like.
Tracking these metrics is a core part of customer support operations, the function responsible for turning raw ticket data into KPIs leadership can act on.
This guide covers the 10 customer service KPIs worth tracking, grouped into the two buckets that matter, with a formula and a benchmark for each. 👇
Key takeaways:
- Customer service metrics fall into two groups: operational metrics (speed and efficiency) and experience metrics (how customers actually feel).
- Speed metrics like first response time, resolution time, and first contact resolution show how efficiently your team works.
- Experience metrics like CSAT, CES, and NPS show whether customers are happy with the help they got.
- Don't track everything. Pick 3 to 5 metrics tied to a specific goal, then add more as your team matures.
- ✨ Featurebase brings your support inbox, surveys, and reporting into one place, so you can track CSAT, response times, and resolution rates without juggling separate tools.
- Benchmarks vary by channel and industry, so treat them as a starting point, not a verdict. The goal is spotting trends and fixing what the numbers point to.
What are customer service metrics?
Customer service metrics are the numbers you use to measure how well your support team performs, both in raw efficiency and in how customers feel about the help they received.
They answer the questions every support lead cares about: Are we fast enough? Are we actually solving problems? Are customers happy when they leave?
This matters more than it used to. 86% of consumers say fast responses and accurate resolutions influence whether they buy, and 88% of customers say the experience a company provides is as important as its products or services. Support is no longer a cost center you tolerate. It's part of the product.
But a metric you don't act on is just a vanity number. The point of tracking these KPIs is to find what's broken and fix it.
The two types of customer service metrics
Almost every metric below falls into one of two camps. Knowing which is which keeps you from comparing apples to oranges, and it's the difference between quantitative and qualitative feedback.
Operational metrics
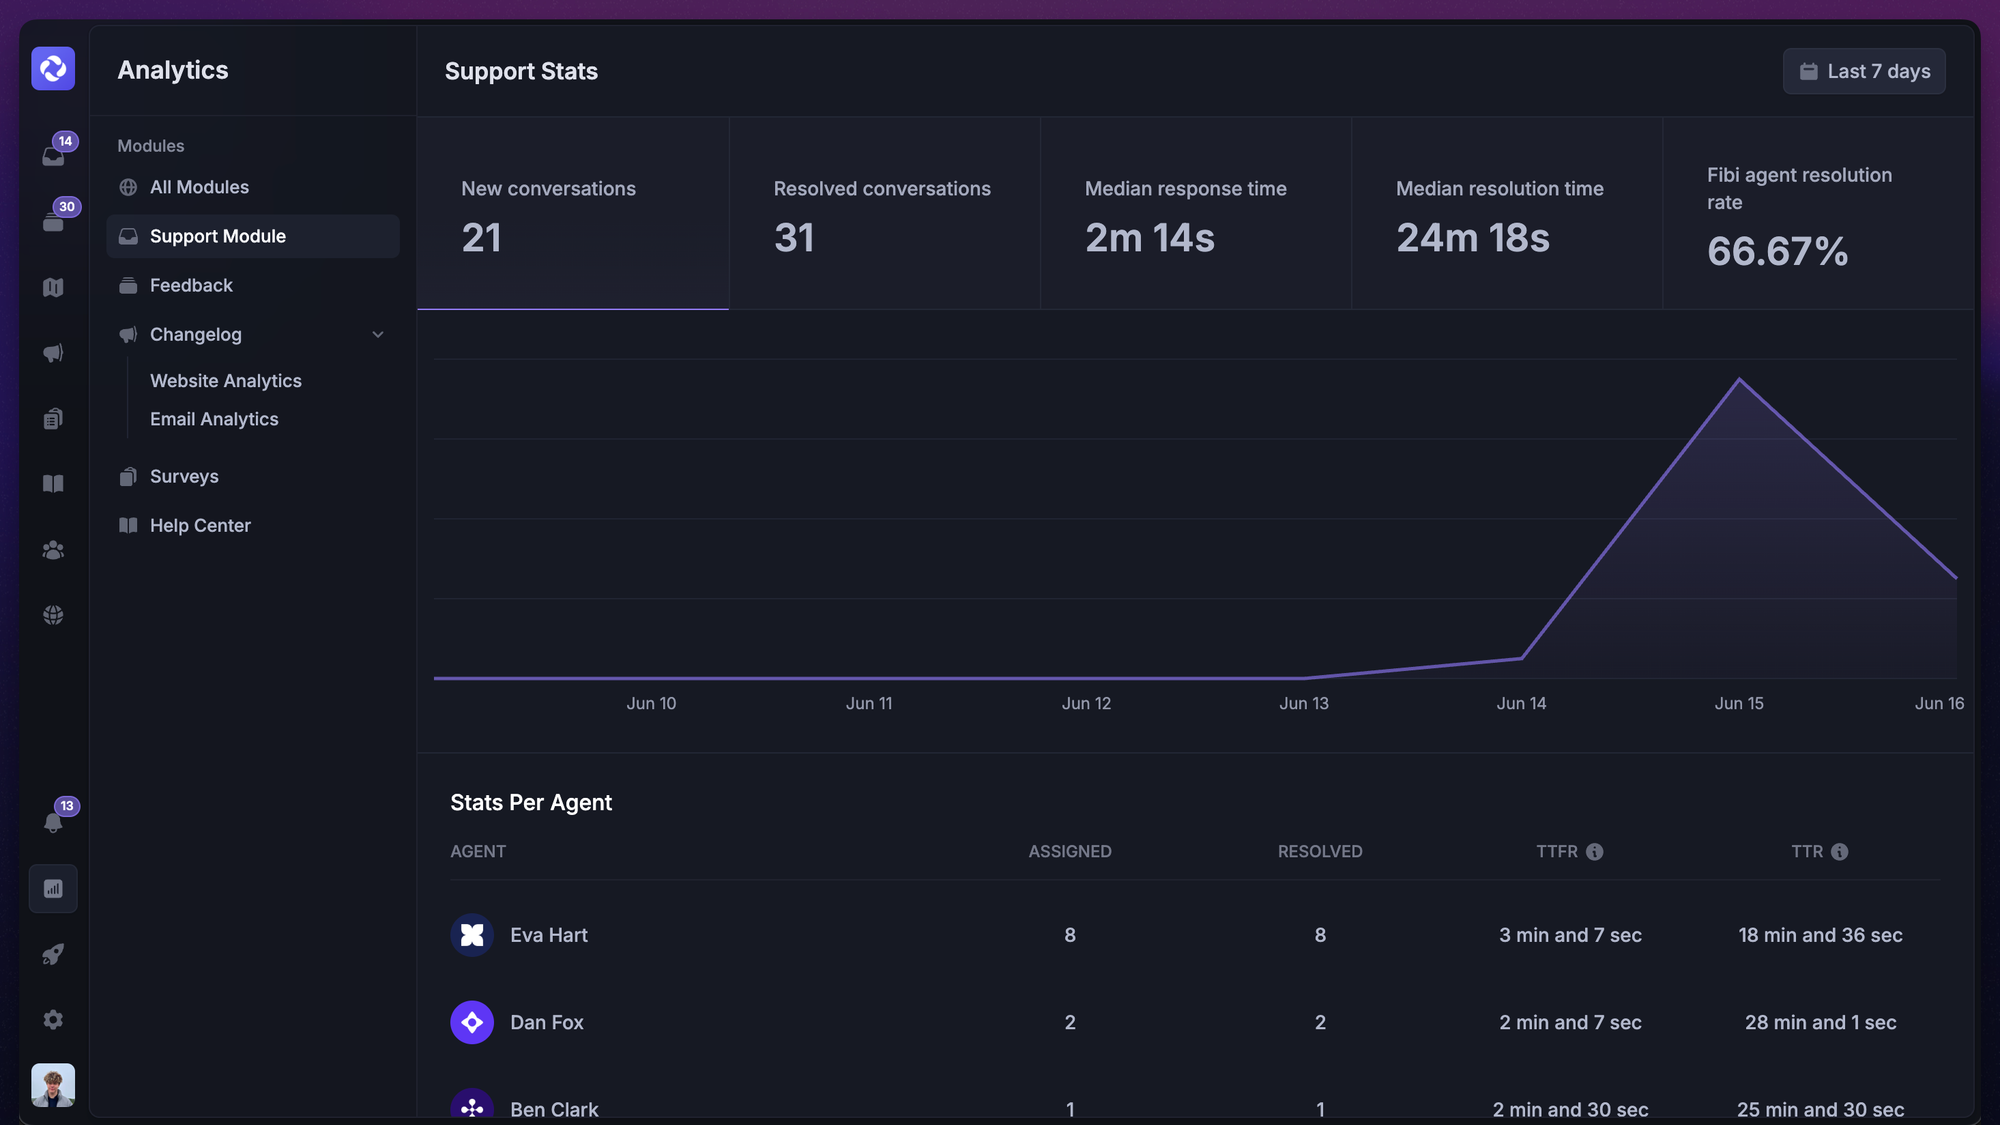
Operational metrics are the hard numbers your tools generate automatically: response times, resolution times, ticket counts. They tell you how efficiently your team handles the workload, but they say nothing about whether the customer walked away satisfied.
Experience metrics
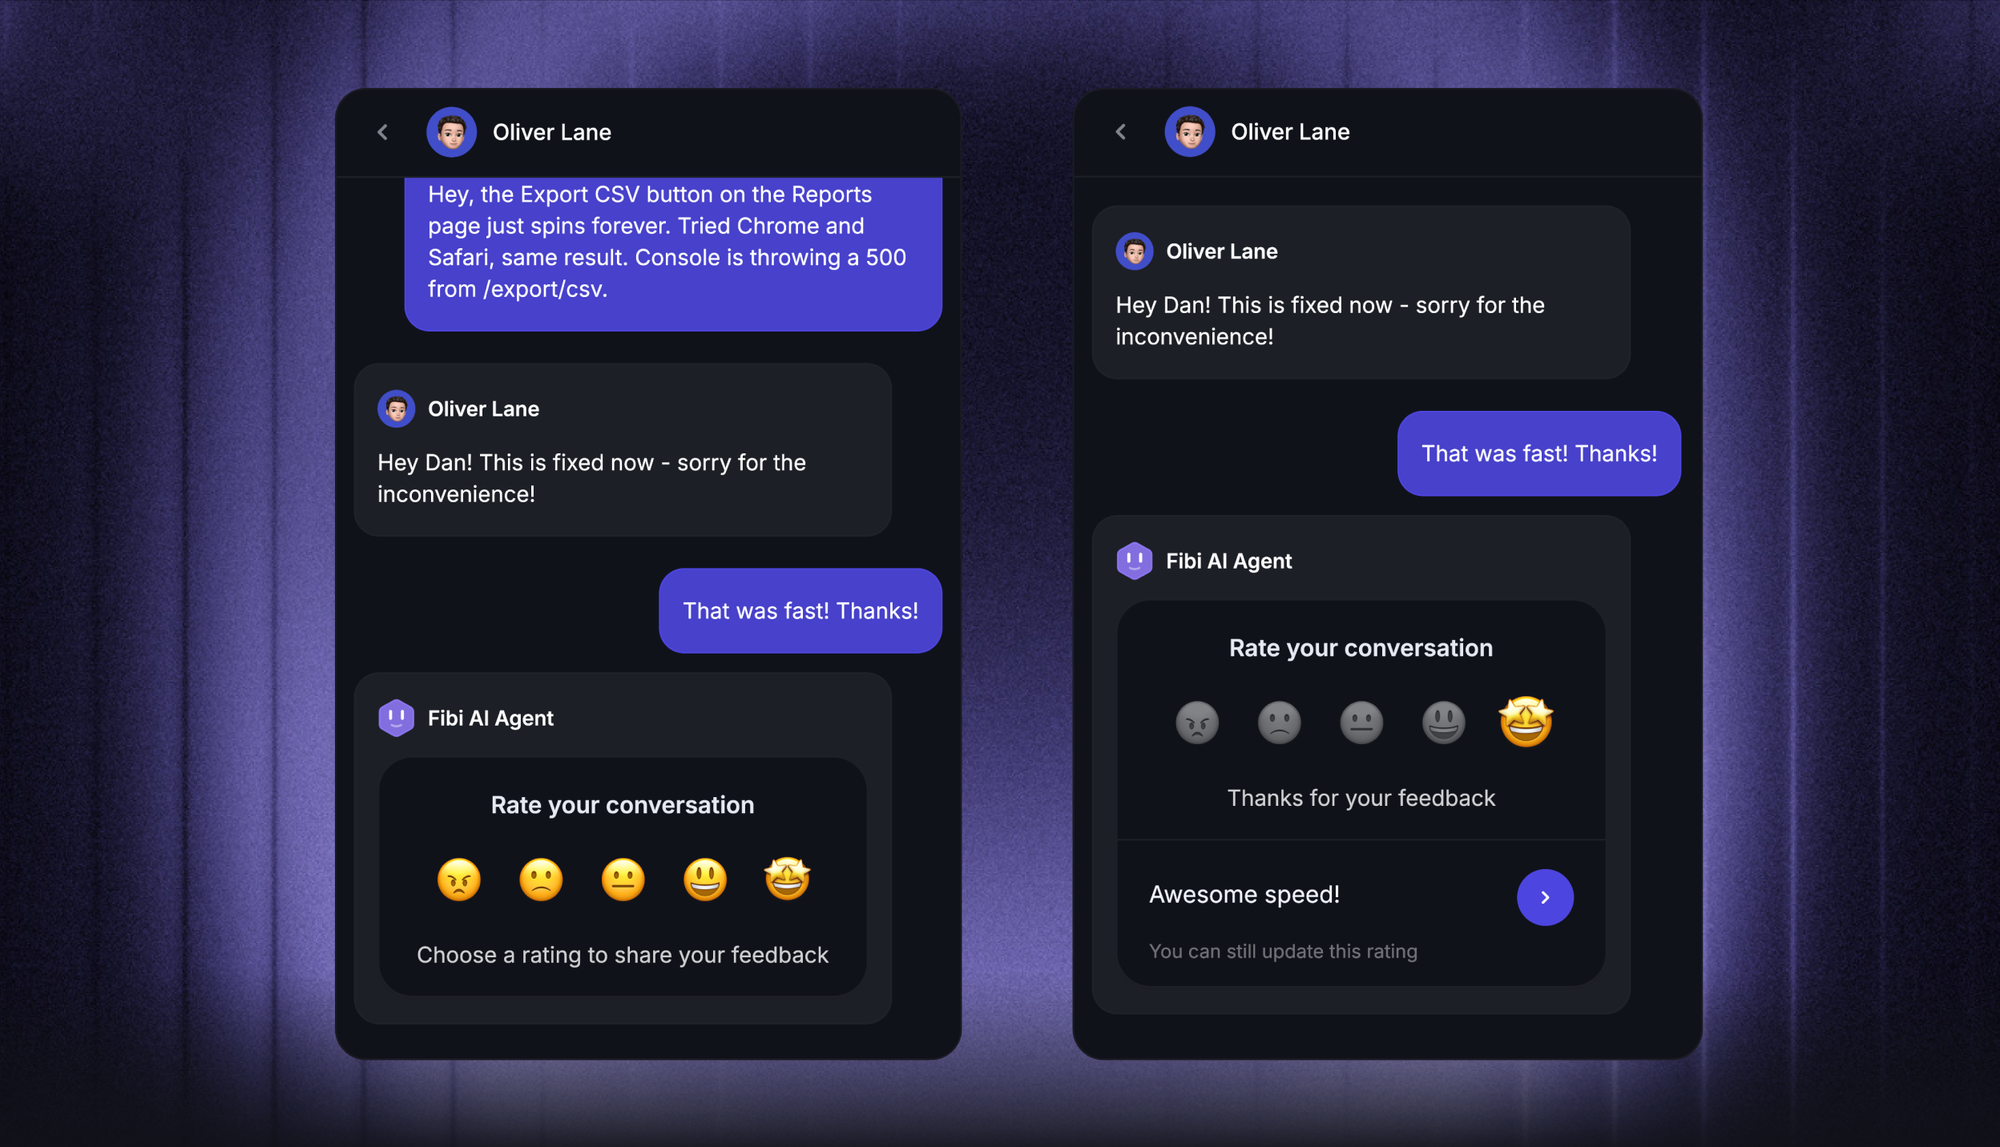
Experience metrics come from the customer, usually through a survey. CSAT, CES, and NPS capture how people actually feel about your service. They add the "why" behind the operational numbers, so a fast resolution time that still produces low CSAT tells you speed isn't the problem.
You need both. Operational metrics without experience metrics measure motion, not outcomes.
Speed and efficiency metrics
These are the operational KPIs. They measure how quickly and how cleanly your team moves a customer from "I have a problem" to "it's solved."
First response time (FRT)
First response time measures how long a customer waits for the first human (or AI) reply after they reach out. It's the metric customers feel most directly, because waiting in silence is the worst part of any support experience.
Formula: Total time to first response ÷ Number of tickets
Targets depend on the channel. Many teams aim for under a minute on live chat, under an hour on social, and under 24 hours on email.
Average resolution time
Average resolution time tracks how long it takes to fully close a ticket, from first contact to final fix. Rising resolution times often point to gaps in your knowledge base or a workload your team can't keep up with.
Formula: Total resolution time for all solved tickets ÷ Number of solved tickets
Average handle time (AHT)
Average handle time is the time an agent actively spends working a single interaction, not counting hold or queue time. It's an efficiency gauge, but chase it too hard and agents start rushing customers to hit a number.
Formula: (Total talk time + hold time + after-contact work) ÷ Number of interactions
First contact resolution (FCR)
First contact resolution is the share of issues solved in a single interaction, with no follow-ups or transfers. It's one of the strongest predictors of satisfaction, because nobody likes being bounced between agents.
Formula: Issues resolved on first contact ÷ Total issues × 100
A healthy FCR usually sits around 70% to 75%, though complex products run lower.
Ticket volume
Every support ticket your team handles feeds these numbers, from first response time to first contact resolution. On its own it's neutral, but spikes are a signal: a jump after a release often points to a bug or a confusing feature, not just busier customers. Pairing volume with ticket handling best practices keeps a busy queue from turning into a backlog.
Formula: Count of tickets received in a given period
Satisfaction and loyalty metrics
These are the experience KPIs. They come straight from customers and tell you whether all that operational efficiency is actually landing.
Customer satisfaction score (CSAT)
CSAT measures how happy a customer was with a specific interaction, usually captured by a quick "How satisfied were you?" survey on a 1 to 5 scale. It's the most direct read on whether a single support touchpoint hit the mark.
Formula: Satisfied responses (4s and 5s) ÷ Total responses × 100
A CSAT above 80% is generally considered strong.
Customer effort score (CES)
CES measures how hard a customer had to work to get their issue resolved, typically by rating a statement like "The company made it easy to handle my issue." The logic is simple: the less effort people spend, the more loyal they stay.
Formula: Average of all effort ratings (usually a 1 to 7 scale)
Net promoter score (NPS)
NPS gauges loyalty by asking how likely someone is to recommend you, on a 0 to 10 scale. It's broader than CSAT, since it measures feeling about your whole brand rather than one ticket. Learn what NPS is in more depth, or see how it stacks up in our NPS vs CSAT breakdown.
Respondents split into three groups:
- Promoters (9-10): loyal fans who'll actively recommend you
- Passives (7-8): satisfied but not enthusiastic, and easily poached
- Detractors (0-6): unhappy customers who can damage your reputation
Formula: % Promoters − % Detractors
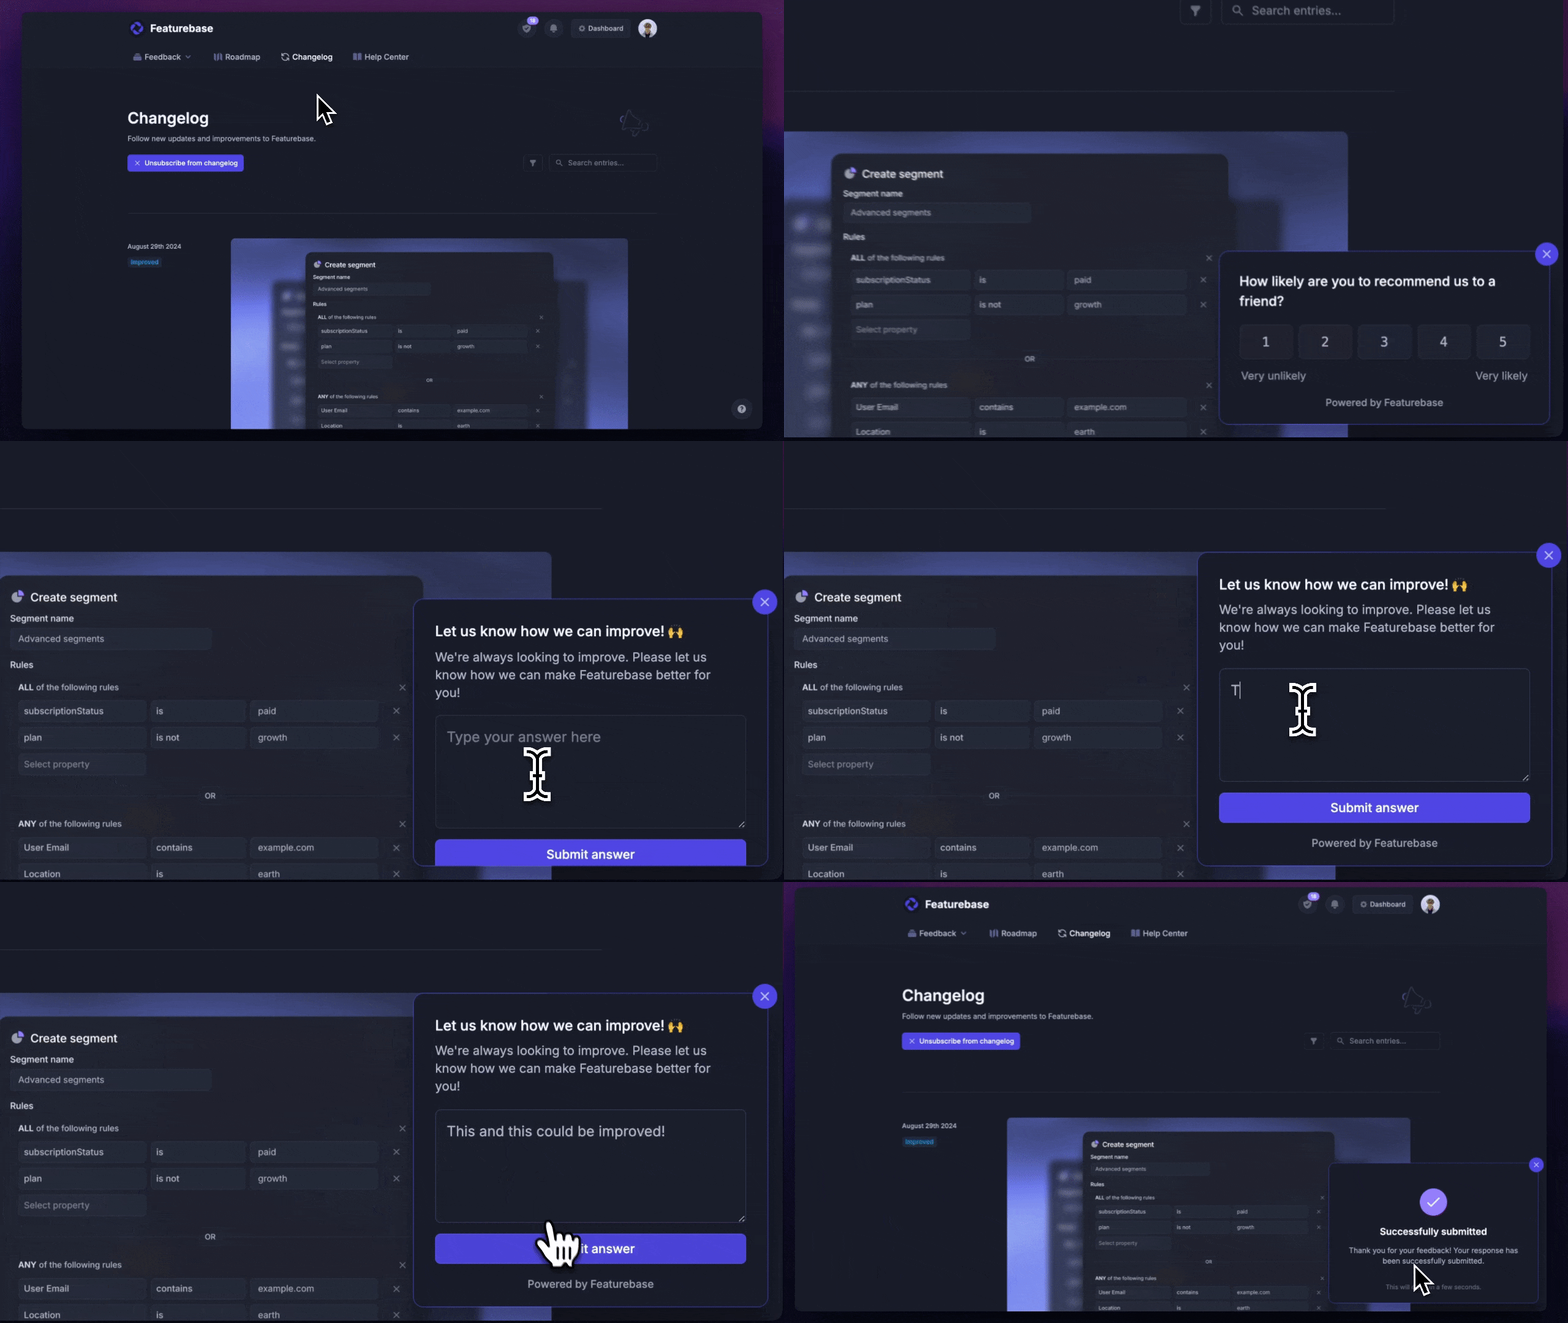
If you'd rather not bolt on a separate survey tool, Featurebase Surveys lets you run targeted in-app NPS and CSAT surveys and send the results straight to the same place your support conversations live.
Customer churn rate
Churn rate is the percentage of customers who stop doing business with you over a period. Support quality is a major driver, so a climbing churn rate is often the downstream symptom of problems your service metrics flagged earlier.
Formula: Customers lost during a period ÷ Customers at the start of the period × 100
Customer retention rate
Retention is churn's mirror image: the share of customers you keep. A high retention rate is the clearest sign your service is building loyalty rather than just closing tickets, and dedicated customer retention software can help you act on it.
Formula: (Customers at end − New customers acquired) ÷ Customers at start × 100
How to choose which metrics to track
Tracking all 10 from day one is a fast way to drown in analytics dashboards and act on none of them. Start narrow.
Pick 3 to 5 metrics tied to a single customer service goal. If you're trying to fix slow support, watch first response time, FCR, and CSAT. If retention is the priority, lean on churn, NPS, and resolution time. Add more only as each one earns its place in your customer service strategy.
The reason to keep it tight is that metrics are only worth tracking if you act on them. McKinsey found that moving customer satisfaction from poor to excellent can cut churn by roughly 75% and nearly triple revenue growth over three years. That payoff comes from improvement, not measurement.
It also helps to keep your numbers in one place. When your inbox, surveys, and reporting are scattered across tools, you spend more time stitching data together than acting on it, which is also why teams invest in a single system to track customer feedback.
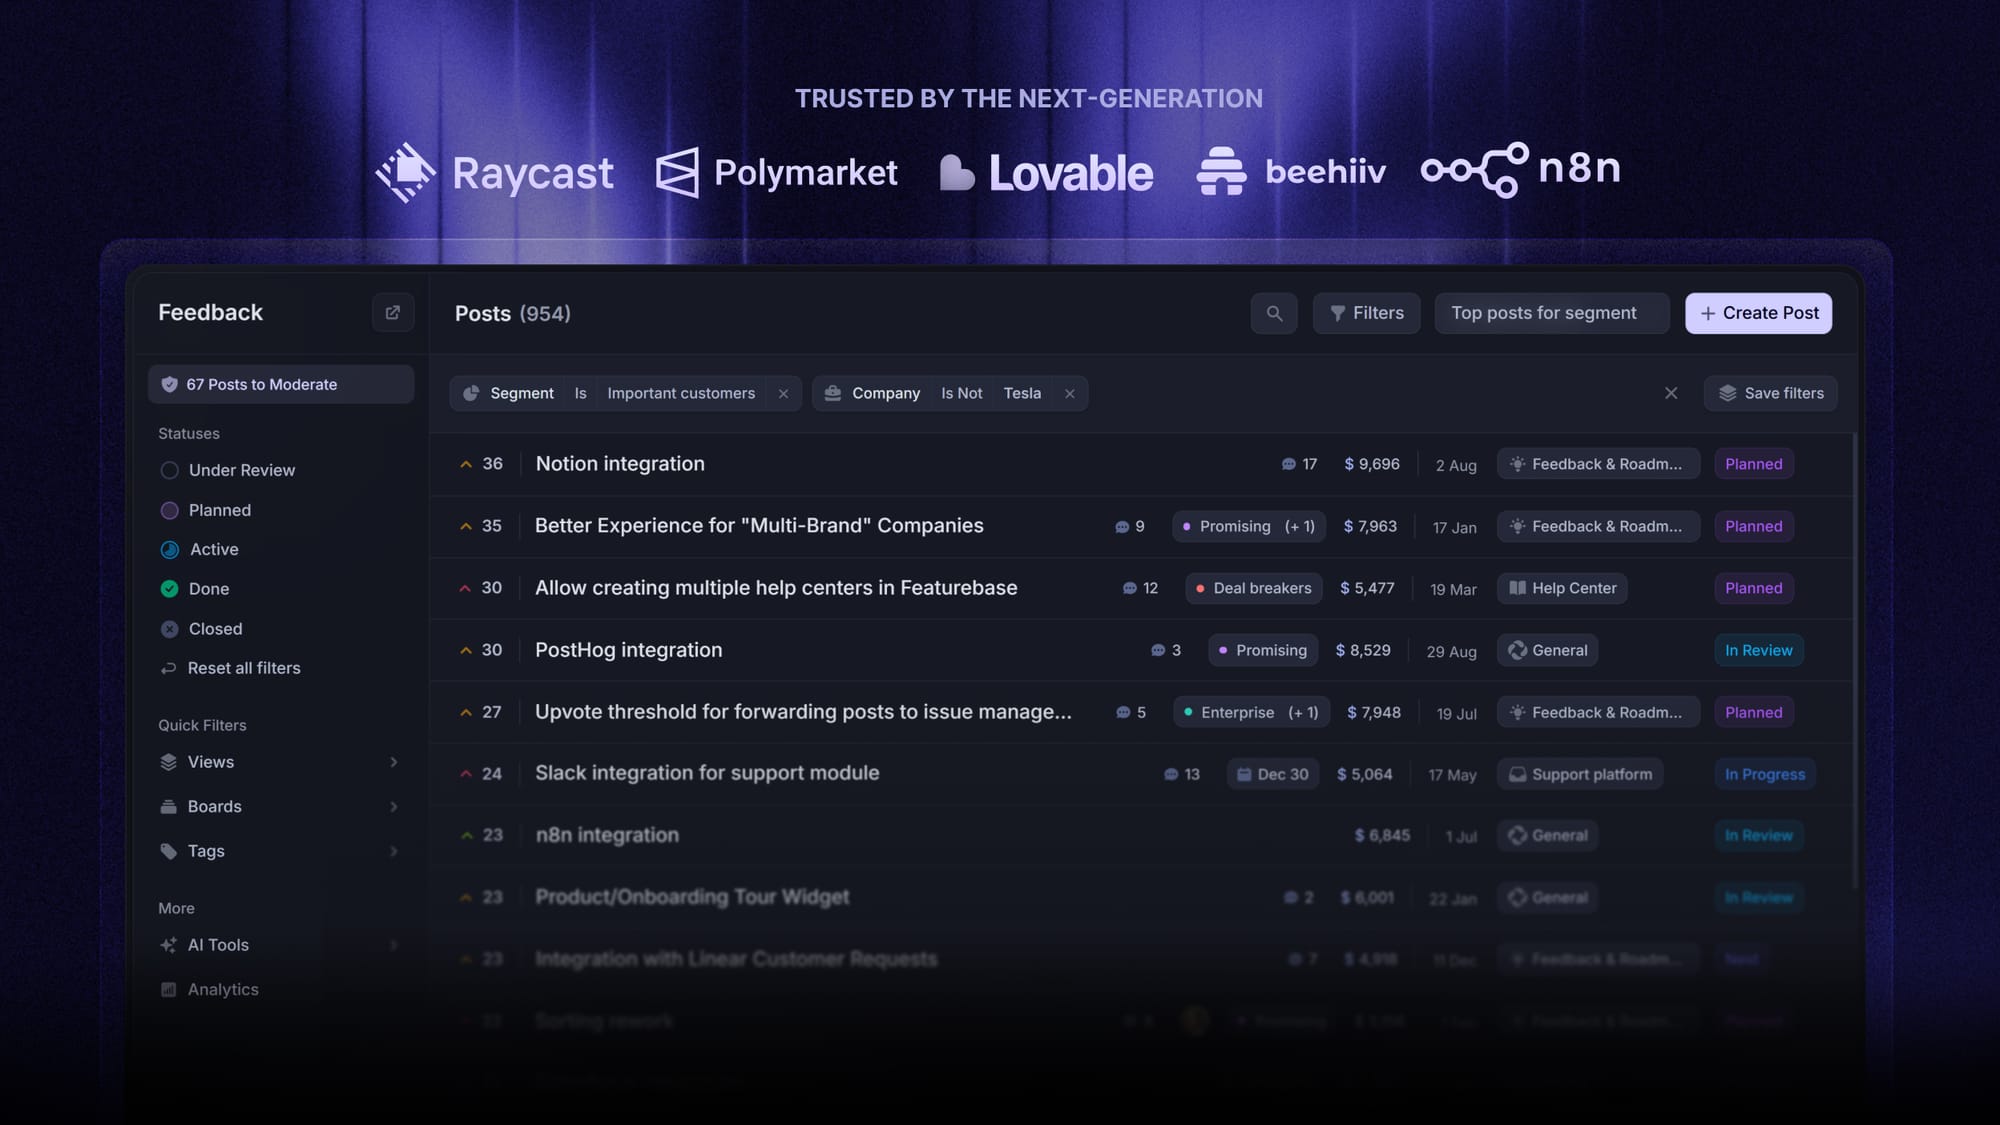
Track your customer service metrics with Featurebase
Most of the friction in measuring support comes from scattered tools. Your response and resolution times live in one system, your CSAT and NPS surveys in another, and pulling them together becomes a weekly chore nobody enjoys. That's the gap Featurebase is built to close.
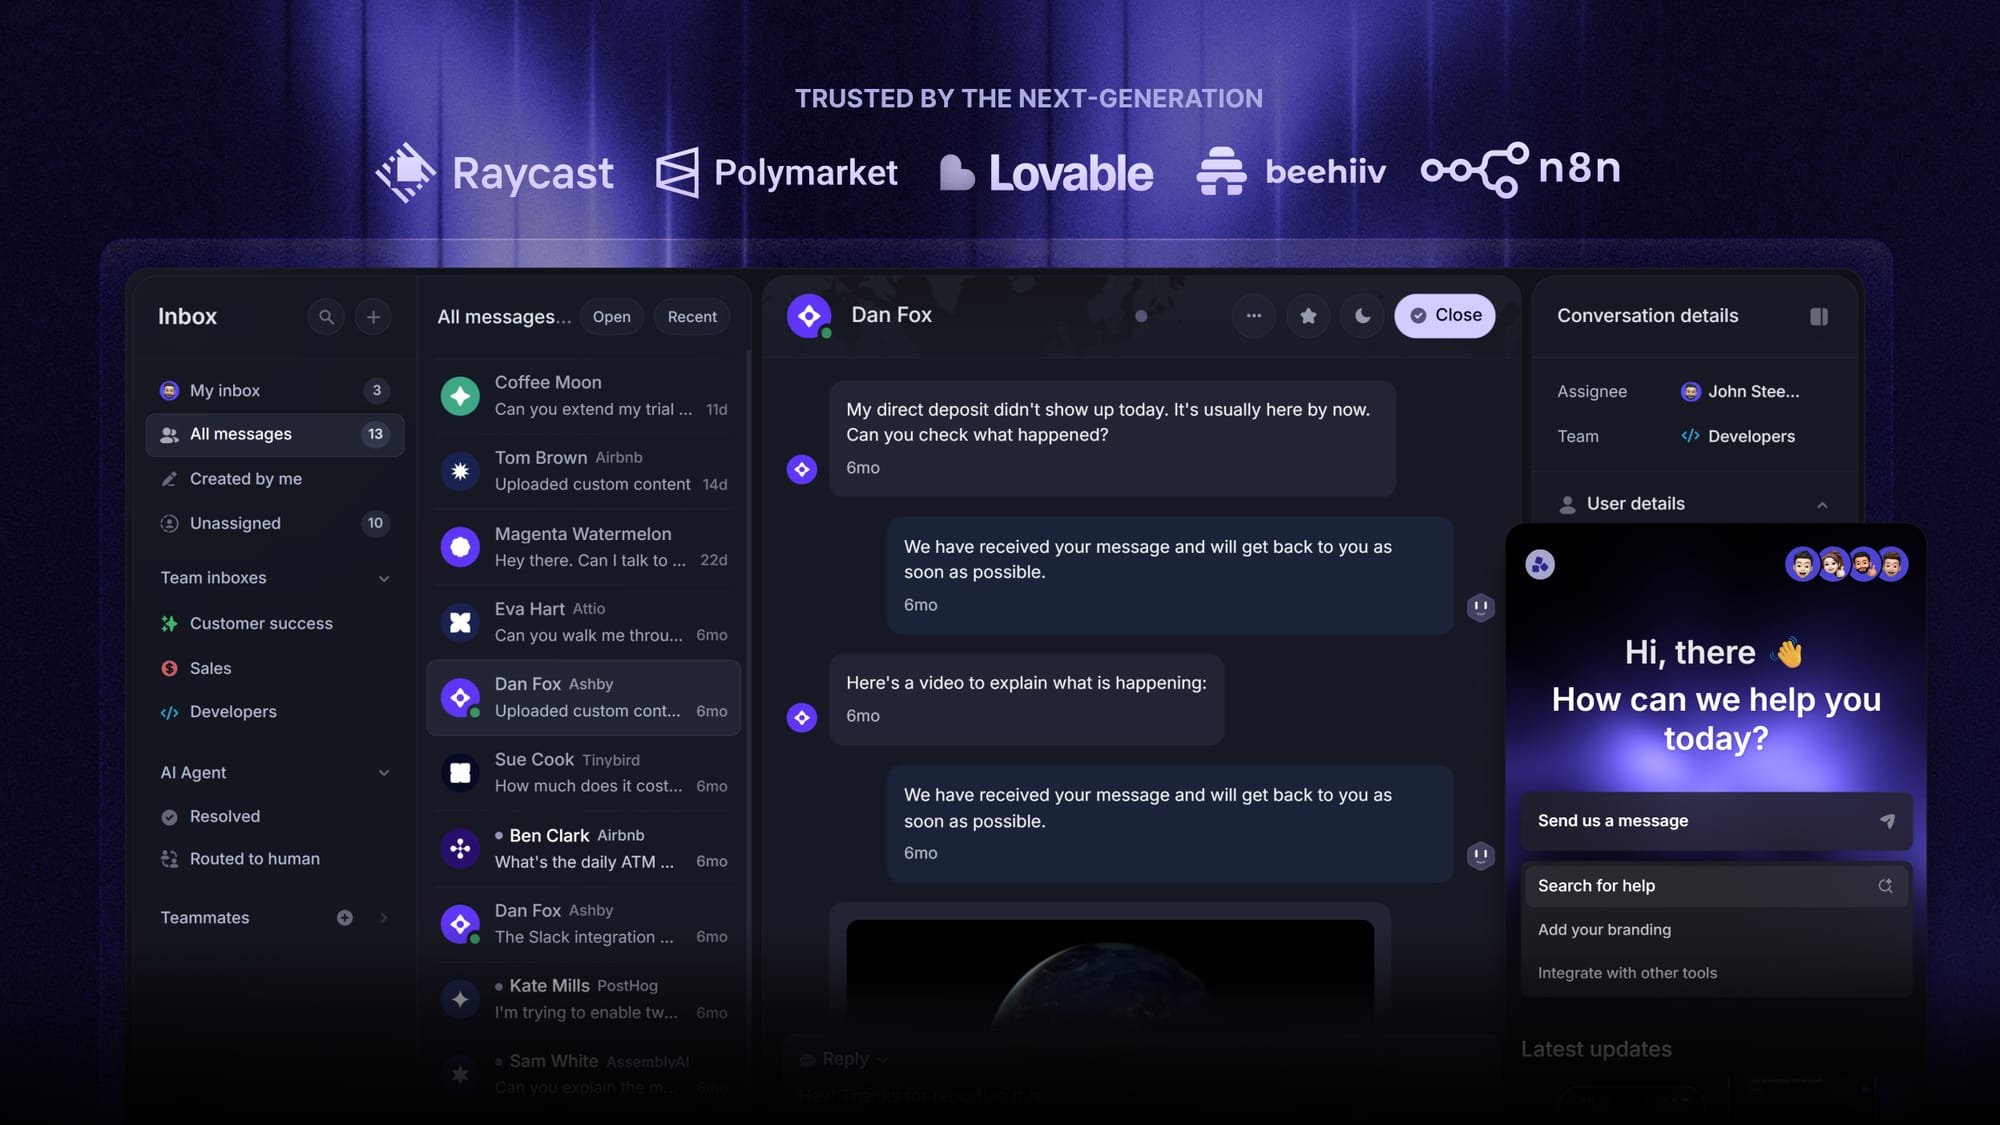
It's a modern support platform that keeps your operational and experience metrics under one roof. Live chat, email, and Slack run through a single omnichannel inbox, so first response time, resolution time, and ticket volume are tracked automatically as your team works. Built-in SLA tracking flags when a conversation is about to breach, and the same workspace runs your NPS and CSAT surveys, so satisfaction sits right next to the speed numbers that drive it.
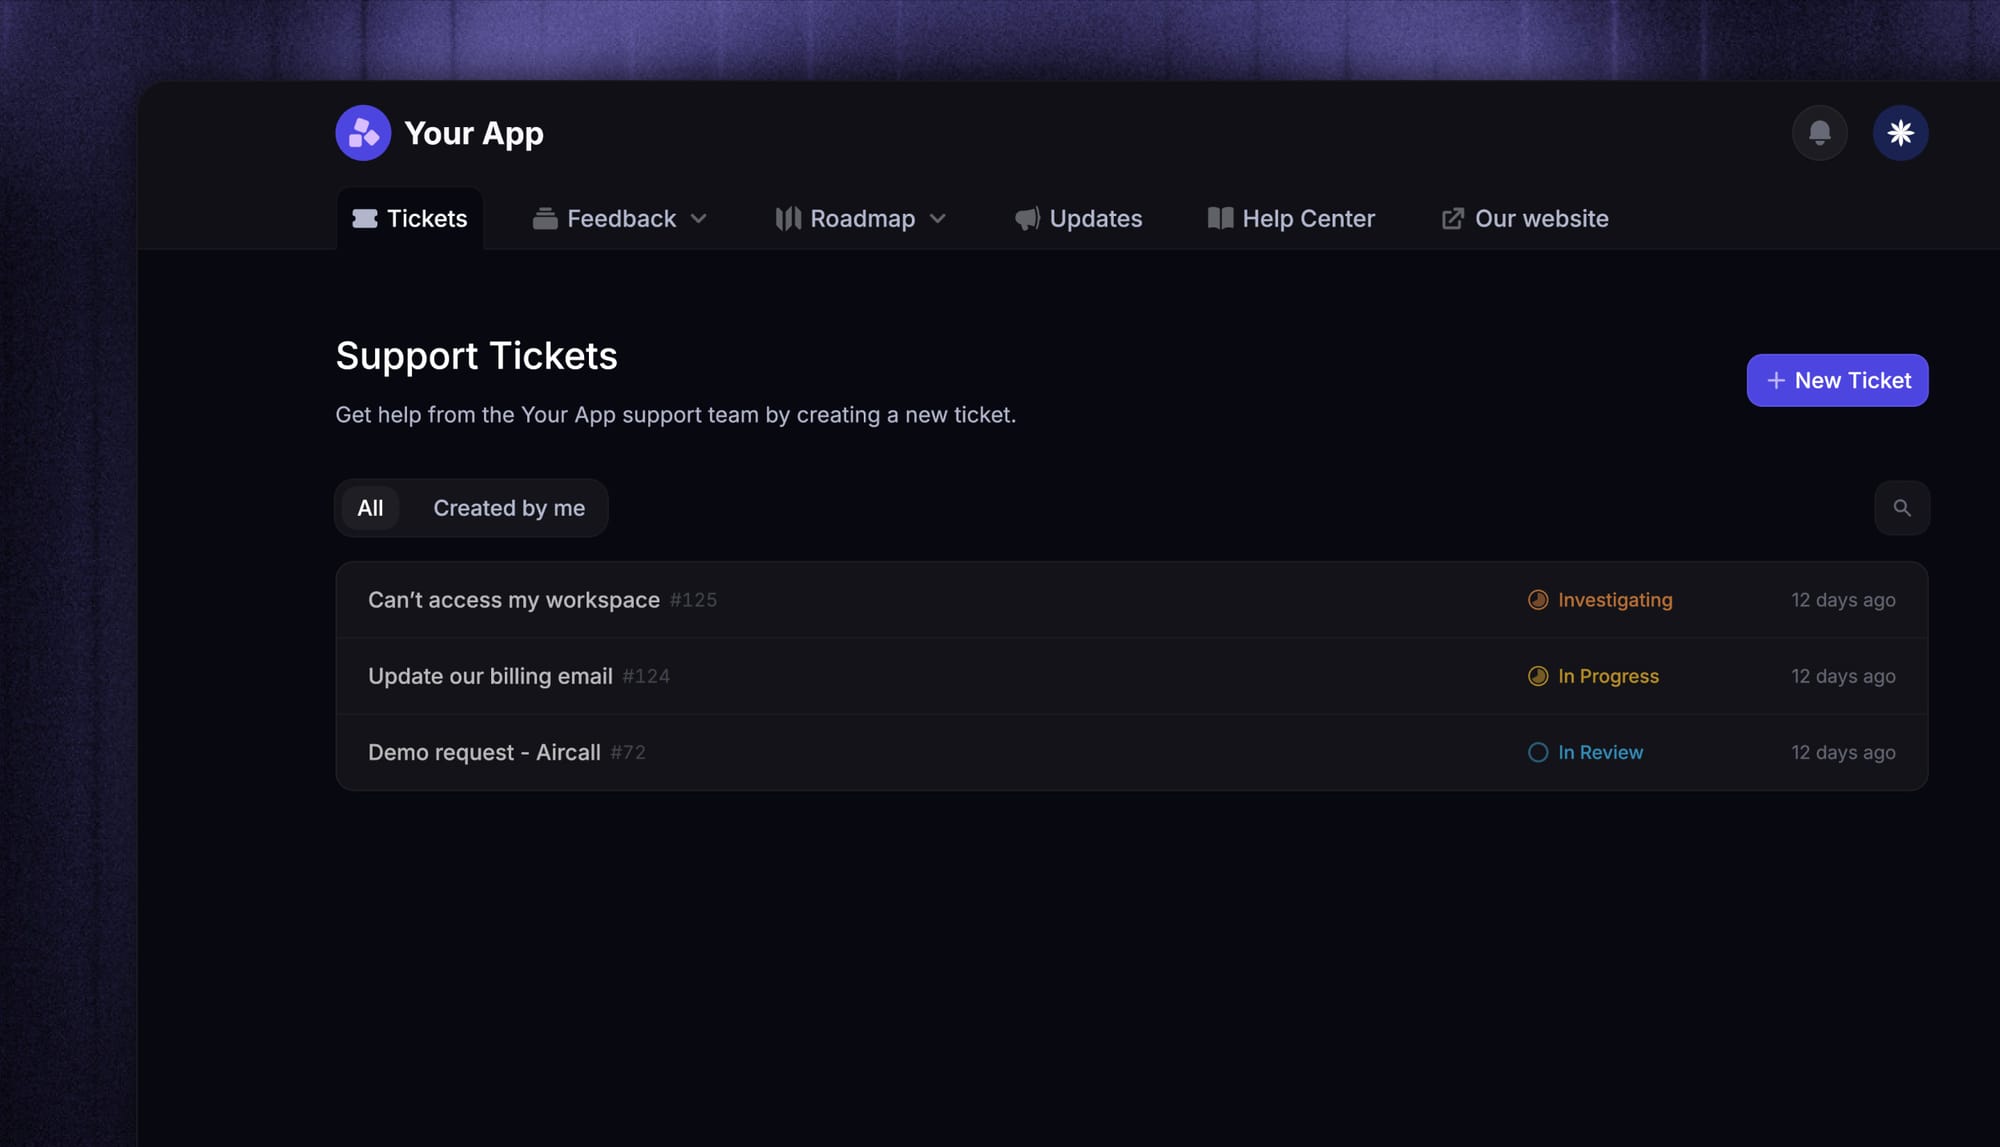
In practice that means you stop exporting spreadsheets to answer "is support getting better?" and just look. The trends are already there, alongside the AI agents and automations that move the numbers in the first place.
It comes with a free plan and quick onboarding (no credit card needed), with paid plans from $29/seat/month, so there's no real downside to trying it on your own metrics.
Conclusion
Customer service metrics are only useful when they change what you do. Group them into operational and experience buckets, pick the few that map to your goal, and watch the trend lines rather than chasing a perfect score.
Featurebase is a modern customer support platform that brings your omnichannel inbox, help center, NPS and CSAT surveys, and reporting together in one place, so you can measure response times, resolution rates, and satisfaction without stitching tools together.
It comes with a Free plan, and the onboarding is quick with no credit card required, so there's no downside to trying it. 👇
✨ Automate your support with the fastest AI-enhanced Inbox today →
Frequently asked questions
How do you measure customer service metrics?
Operational metrics like response and resolution time are pulled automatically from your helpdesk or support platform. Experience metrics like CSAT, CES, and NPS come from short surveys sent after an interaction. The cleanest setup keeps both in one tool so you can see efficiency and satisfaction side by side.
What are good customer service metrics to start with?
Start with 3 to 5 metrics tied to one goal rather than tracking everything. A solid starter set is first response time, first contact resolution, and CSAT, which together cover speed, effectiveness, and satisfaction. Add churn, NPS, or resolution time once those become routine.
What are the 4 most important customer service metrics?
If you had to pick four, most teams land on CSAT, first contact resolution, first response time, and customer effort score. They balance the two things that matter: how efficiently you handle requests and how customers feel about the outcome. The right four for you still depend on your goals.
What are average customer service benchmarks?
Common rules of thumb are a CSAT above 80%, first contact resolution around 70% to 75%, and first response times under a minute on live chat or under 24 hours on email. These vary widely by channel, industry, and product complexity, so use them as a directional target rather than a pass-fail line.
What's the difference between customer service and customer experience metrics?
Customer service metrics measure support interactions: how fast you reply, how often you resolve issues, how satisfied customers are with the help. Customer experience metrics cover the entire journey, including onboarding, product, and billing, not just support. There's overlap, but service metrics are a subset. Our guide on customer service vs customer support digs into the related terminology.
What tools do you need to track customer service metrics?
At minimum you need a helpdesk that reports operational data and a survey tool for CSAT and NPS. Running both through one customer service software platform is simpler than syncing separate tools, since your response times, resolution rates, and satisfaction scores all live in the same place.