Blog Customer ServiceCustomer Service KPIs: 12 Metrics That Drive Results
Customer Service KPIs: 12 Metrics That Drive Results
Customer service KPIs only work if you commit to 4-6 of them, not 15. This guide breaks down the 12 metrics that matter most, groups them by what they actually tell you, and gives you a framework for picking the right ones for your team - with real benchmarks from SQM Group, HBR, and Bain.


,✨ Automate your support with the fastest AI-enhanced Inbox today →
Tracking customer service KPIs is easy. Picking the right 4-6 that actually move the business is the hard part. Most support leaders end up staring at 15-row dashboards, wondering which numbers matter.
The teams that win at support don't track more metrics. They track the right few, group them so each metric clearly answers a question they care about, and act on patterns. This guide gives you the 12 KPIs that matter most, organized by what they tell you, with real benchmarks and a framework for picking your own. 👇
Key takeaways:
- Customer service KPIs fall into 4 categories: satisfaction, speed, resolution quality, and efficiency. Strong teams track 1-2 from each.
- The 3 satisfaction KPIs that matter most are CSAT, CES, and NPS. They measure different things and tell different stories.
- First Contact Resolution (FCR) is the single most correlated metric with customer satisfaction. SQM Group's benchmarking research shows a 1% lift in FCR drives a 1% lift in CSAT across most industries.
- Don't track Average Handle Time in isolation. It's the easiest metric to game and the most likely to push agents into rushed, low-quality interactions.
- A good CSAT sits between 75% and 85% for most industries. A good FCR sits between 70% and 79%, with world-class teams hitting 80%+.
- The KPIs that look most impressive in a quarterly report (ticket volume, tickets resolved) often have the weakest connection to revenue. Pair every operational metric with an experiential one.
- Featurebase✨ gives you an AI-powered support inbox with built-in reporting for response time, handle time, CSAT, and NPS - so you can actually track and act on these KPIs without stitching together 3 separate tools.
What are customer service KPIs?
Customer service KPIs (key performance indicators) are the small, focused set of measurements that tell you whether your support operation is working. They cover how customers feel about your service, how efficiently your team handles requests, and how reliably issues get resolved.
The keyword here is "small." Most helpdesks expose dozens of metrics, but a KPI is the subset you've decided to act on. If a number doesn't change your decisions, it's a metric. If it changes how you train agents, staff shifts, build self-serve content, or escalate to product, it's a KPI.
Metrics vs KPIs
These two words get used interchangeably, but they aren't the same thing:
- A metric is any quantifiable measurement your tools spit out: tickets opened, average time to resolution, response time per channel, agent login hours.
- A KPI is a metric you've committed to as a target. It's tied to a goal, has a benchmark, gets reviewed regularly, and someone is accountable for it. Pair this with the right customer service software and a KPI becomes something you can act on weekly, not just review quarterly.
You'll measure dozens of metrics. You should commit to 4-6 KPIs at most. Tracking more than that and your team loses focus on which numbers actually matter.
Why customer service KPIs matter
The case for tracking customer service KPIs comes down to one number: retention. Customer service interactions are where loyalty either gets reinforced or broken, and the cost difference between keeping customers and replacing them is enormous.
Research by Frederick Reichheld of Bain & Company, published in Harvard Business Review, found that a 5% increase in customer retention can lift profits by 25% to 95% depending on the industry. Customer service is the front line of that retention work. If you can't measure how it's performing, you can't improve it, and you can't make the business case for investing more in it.
The benefits compound from there:
- Spot problems early: A drop in CSAT or a spike in escalations shows up in your KPIs weeks before it shows up in revenue. That gives you time to fix it.
- Coach with evidence: Agent-level KPIs let you identify training gaps with data, not anecdotes. You stop arguing about who's doing well and start fixing what's broken.
- Resource planning: Volume trends tell you when to hire, when to add a chatbot, and when to build out self-serve content. Without them you're flying blind.
- Connect support to the business: Once you can show that better FCR drives higher retention drives higher revenue, support stops being a cost centre and starts being a growth lever.
The 4 categories of customer service KPIs
Before the list, the framing. Every customer service KPI worth tracking falls into one of 4 categories, and each category answers a different question:
- Satisfaction KPIs answer "how do customers feel about us?" They're the experience side of the equation - CSAT, CES, NPS. Customer feedback drives these.
- Speed KPIs answer "how fast are we?" These are operational metrics about response and handling - FRT, AHT, ART. Your helpdesk drives these.
- Resolution quality KPIs answer "are we actually solving problems?" Speed without resolution is just churn with extra steps - FCR, escalation rate, reopen rate.
- Efficiency & volume KPIs answer "are we sustainable?" Ticket volume, abandonment, retention. These tell you whether the operation can scale.
Strong support teams track 1-2 from each category. That gives you the full picture - feeling, speed, quality, and sustainability - without drowning in dashboards.
12 customer service KPIs that actually drive results
Satisfaction KPIs
1. Customer Satisfaction Score (CSAT)
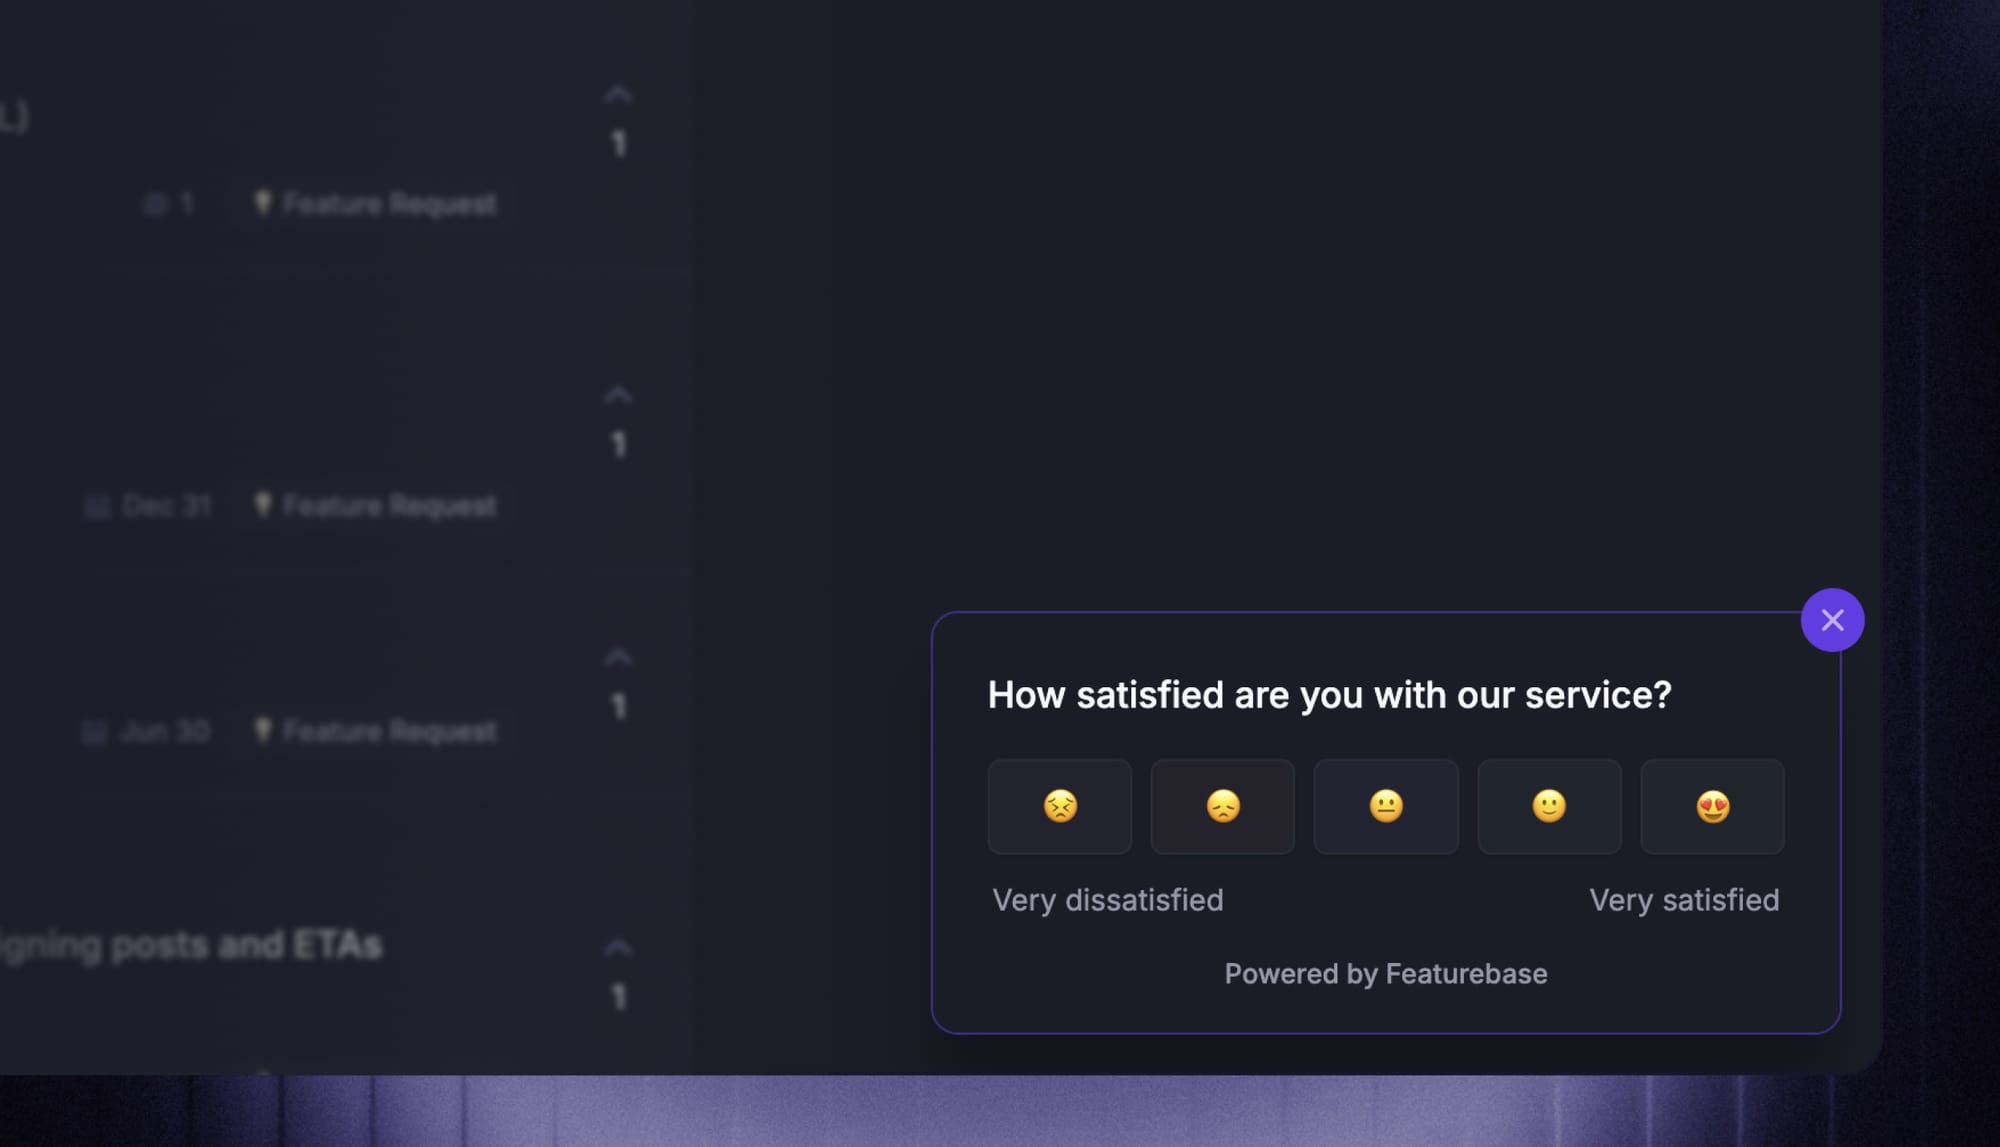
CSAT is the most direct measure of how customers feel about a specific interaction or product. After a conversation closes, you send a 1-question survey ("how satisfied were you?") on a 1-5 or 1-10 scale, then track the percentage who answered positively.
Formula: (Number of satisfied responses ÷ Total responses) × 100
Why it matters: CSAT is your first signal that something's working or broken in the support experience. Track it per agent, per channel, and per issue type to spot patterns.
Benchmark: 75-85% is solid for most industries. B2C ecommerce sits in the 76-78% range. Top-performing SaaS teams target 90%+. Anything under 70% needs immediate attention.
Watch out for: Survey response bias. The customers most likely to fill out a survey are the angry ones and the delighted ones. Boring "fine" experiences go unreported, which can distort your average. Aim for high response rates by keeping surveys short - one question is plenty.
2. Customer Effort Score (CES)
CES measures how hard customers had to work to get their issue resolved. A typical survey question is "on a scale of 1-7, how much effort did it take to get your problem solved?" Lower is better.
Formula: Total sum of CES responses ÷ Number of responses
Why it matters: Effort predicts loyalty better than satisfaction does. Gartner's research on CES found that low-effort experiences are stronger predictors of repeat purchases than CSAT or NPS. Customers who said "this was easy" come back. Customers who said "this was hard" leave, even when the issue got resolved.
Benchmark: 5+ out of 7 is the bar most teams aim for.
Watch out for: A great CES on a single interaction doesn't mean a great relationship overall. Pair it with NPS or retention for the full picture.
3. Net Promoter Score (NPS)
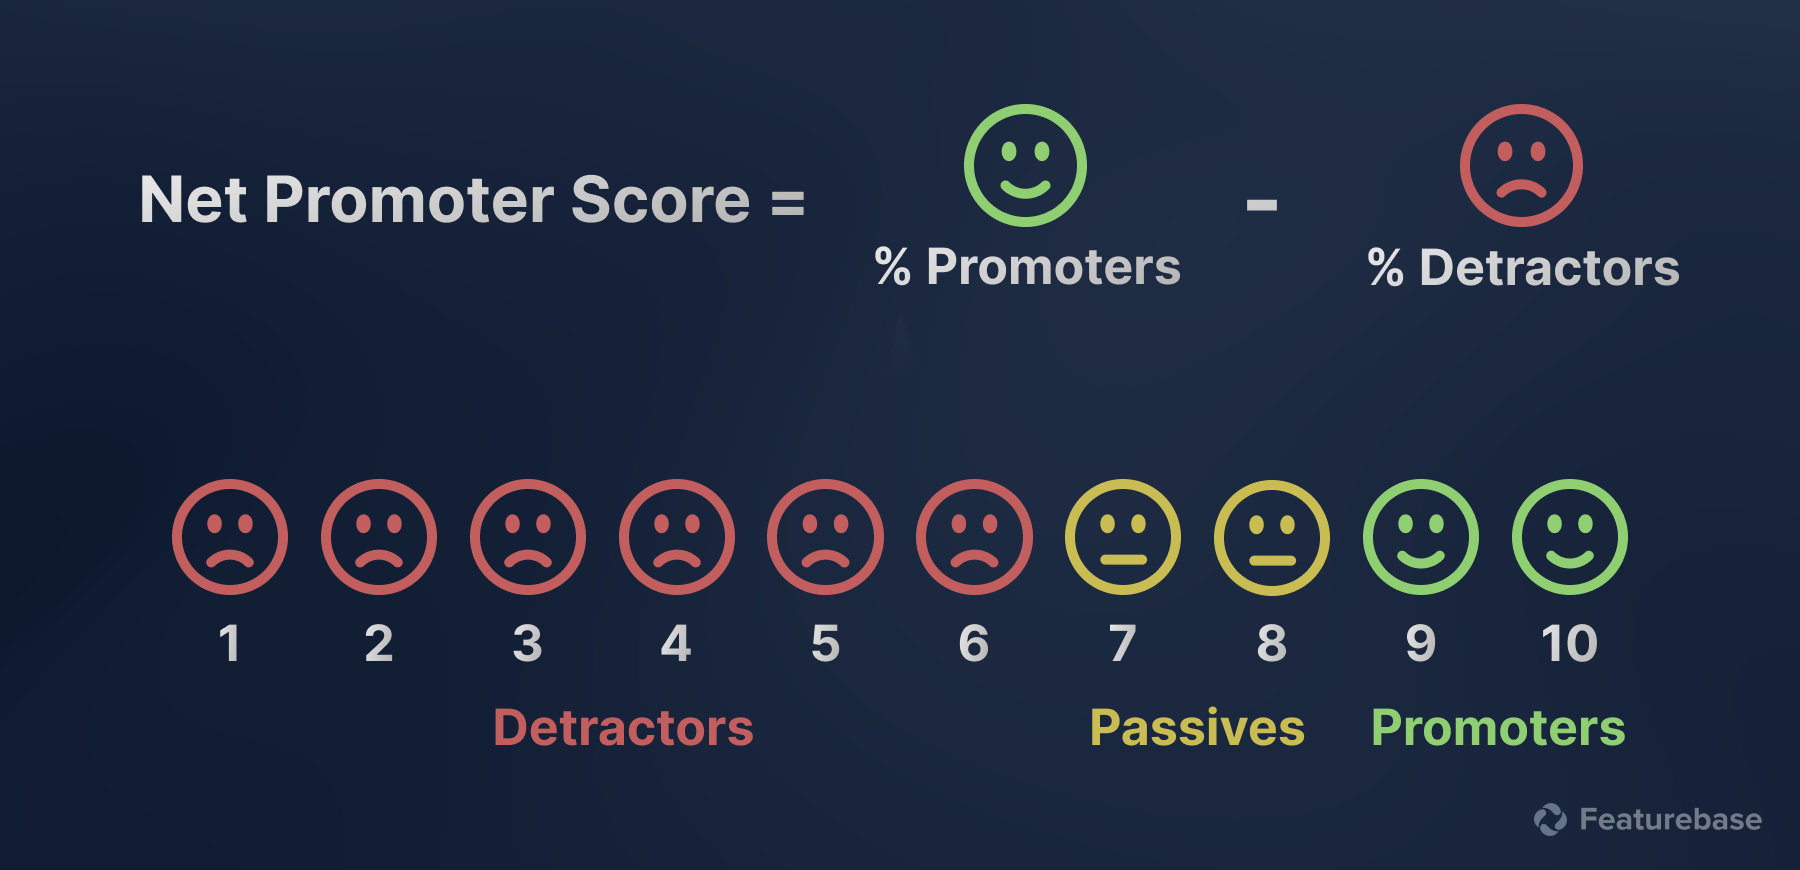
NPS measures whether customers would recommend your brand. You ask "on a scale of 0-10, how likely are you to recommend us?" then split respondents into promoters (9-10), passives (7-8), and detractors (0-6).
Formula: % Promoters − % Detractors
Why it matters: NPS captures the broader relationship, not just the latest interaction. A high score correlates with word-of-mouth growth and lower customer acquisition costs.
Benchmark: The global average across industries is around 32, according to recent benchmarking studies. Tech and services average closer to 50. Anything above 50 is excellent. Below 0 means you have more detractors than promoters, which is a serious warning.
Watch out for: NPS reflects everything about your brand experience, not just support. Use it for trend tracking, not as the single judge of your support team.
Speed KPIs
4. First Response Time (FRT)
FRT measures how long a customer waits between submitting a request and getting an initial human reply. An automated "we got your message" doesn't count - this is about a real response.
Formula: Total time to first response ÷ Number of tickets
Why it matters: Speed is the single most visible part of the support experience. Customers don't always notice great solutions, but they always notice waiting.
Benchmark by channel:
- Live chat - under 1 minute
- Phone - under 3 minutes
- Social media - under 1 hour
- Email - under 24 hours, ideally under 12
Watch out for: Measure FRT in business hours only, unless your team is 24/7. Otherwise weekends and holidays will skew the number and demotivate agents.
5. Average Handle Time (AHT)
AHT is the average time an agent spends on a single ticket from start to finish, including talk time, hold time, and any after-call work.
Formula: (Total talk time + Hold time + After-call work) ÷ Number of interactions
Why it matters: AHT signals operational efficiency. Lower AHT means more tickets handled per agent per day, which keeps cost per contact down.
Benchmark: 2-5 minutes for live chat, 5-8 minutes for ecommerce support calls. Complex B2B issues legitimately take longer.
Watch out for: This is the easiest customer service KPI to game and the most dangerous to track in isolation. Agents who feel pressured to lower AHT will rush, mark issues as resolved before they're actually fixed, and tank your CSAT and FCR. Always pair AHT with a resolution quality KPI.
6. Average Resolution Time (ART)
ART measures the total time from when a ticket is opened to when it's fully resolved, including all back-and-forth.
Formula: Total time to resolve all tickets ÷ Number of resolved tickets
Why it matters: ART is the customer-experienced version of AHT. They don't care how long an agent spent typing - they care when their problem got solved.
Benchmark: Under 5 minutes for live chat resolutions, under 2 hours for email, under 24 hours for complex tickets.
Watch out for: Segment ART by issue complexity. A 3-day resolution time on a billing dispute is fine. A 3-day resolution time on a login bug is a disaster. Average everything together, and you lose the signal.
Resolution quality KPIs
7. First Contact Resolution (FCR)
FCR is the percentage of customer issues fully resolved in the first interaction, without callbacks, transfers, or follow-up tickets.
Formula: (Issues resolved on first contact ÷ Total issues) × 100
Why it matters: This is arguably the single most important customer service KPI. SQM Group's annual benchmarking study, based on 500+ North American call centres, found that FCR is the highest-correlated internal metric to CSAT. A 1% improvement in FCR drives a 1% improvement in customer satisfaction. It also cuts operating costs by roughly 1% for every 1% of FCR gained.
Benchmark: 70-79% is solid. 80%+ is world-class. SQM's industry averages: Retail 78%, Insurance 76%, Financial 71%, Tech Support 65%, Telco 61%.
Watch out for: Definition drift. If "resolved" means "agent marked it closed," some agents will close tickets prematurely to boost their FCR. Define resolution as "no reopen within 7 days" to keep the metric honest.
8. Escalation Rate
Escalation rate measures the percentage of tickets that need to be passed up to a senior agent, manager, or specialist team.
Formula: (Escalated tickets ÷ Total tickets) × 100
Why it matters: High escalation rates point to either training gaps, missing tools, or overly complex policies. Front-line agents who can't resolve issues themselves frustrate both customers and themselves.
Benchmark: Under 10% for routine support, up to 20% for complex B2B or enterprise tiers.
Watch out for: Some escalations are healthy - customers asking for a manager on legitimate complaints, for example. Track the trend, not the absolute number.
9. Reopen Rate
Reopen rate is the percentage of resolved tickets that customers reopen because the issue wasn't actually fixed.
Formula: (Reopened tickets ÷ Total resolved tickets) × 100
Why it matters: Reopen rate is the truth serum for FCR. If your FCR looks great but reopen rate is climbing, agents are closing tickets too aggressively.
Benchmark: Under 10% is healthy. Above 15% means quality is slipping.
Watch out for: Reopens can happen for reasons outside the agent's control (the customer didn't read the response, the bug came back). Sample and review your reopens monthly using ticket handling best practices to understand the real drivers before coaching agents on the number.
Efficiency & volume KPIs
10. Ticket Volume
Ticket volume is the total number of customer service requests over a defined period (daily, weekly, monthly).
Formula: Count of tickets received in the period
Why it matters: Volume is the foundation for every other KPI. It tells you when to staff up, when a product release is causing problems, and when seasonal patterns are kicking in.
Benchmark: There's no universal "good" number. The real benchmark is the trend. A sudden spike after a release is a signal something's broken. A steady decline alongside growing user counts means your self-serve content, in-app guidance, or product UX is working.
Watch out for: Falling ticket volume isn't always good. If it's because customers are giving up before contacting you, you're losing them silently. Cross-check with CSAT and churn.
11. Abandonment Rate
Abandonment rate is the percentage of customers who hang up or close a live chat before being connected to an agent.
Formula: (Abandoned interactions ÷ Total interactions) × 100
Why it matters: A high abandonment rate is a flashing red light. It means customers are reaching out, hitting a wall, and giving up. That's the most expensive kind of churn because you never get to see it coming.
Benchmark: Under 2% is excellent, under 5% is acceptable, anything above 5% needs investigation.
Watch out for: Abandonment often correlates with wait time. If your FRT is climbing, abandonment is climbing too. Fixing one usually fixes the other.
12. Customer Retention Rate (CRR)
CRR is the percentage of customers who stay with your business over a defined period, after subtracting new sign-ups. It's the single biggest reason to invest in customer retention software and put real measurement behind your support operation.
Formula: [(End-period customers − New customers) ÷ Start-period customers] × 100
Why it matters: This is the KPI that connects support directly to revenue. Customer service is one of the biggest levers on retention, and retention is one of the biggest levers on profitability.
Benchmark: 70%+ for most SaaS, 60-70% for retail, 90%+ annually for B2B enterprise.
Watch out for: CRR is a lagging indicator. By the time it drops, the damage is done. Treat satisfaction and effort KPIs as leading indicators - they tell you where retention is heading before it gets there.
Benchmarks: What good looks like in 2026
Putting the most-asked-about benchmarks in one place so you don't have to scroll back:
| KPI | Solid | Excellent |
|---|---|---|
| CSAT | 75-85% | 90%+ |
| CES | 5/7 | 6/7 |
| NPS | 30-50 | 50+ |
| FRT (live chat) | Under 2 min | Under 1 min |
| FRT (email) | Under 24 hrs | Under 12 hrs |
| AHT (chat) | 2-5 min | Under 3 min |
| ART (email) | Under 2 hrs | Under 1 hr |
| FCR | 70-79% | 80%+ |
| Escalation rate | Under 10% | Under 5% |
| Reopen rate | Under 10% | Under 5% |
| Abandonment rate | Under 5% | Under 2% |
| CRR (SaaS) | 70-80% | 90%+ |
Benchmarks vary by industry, company size, and channel. The numbers above are based on cross-industry research from SQM Group, Retently, Zendesk CX Trends, and synthesized vendor benchmarking. Use them as starting targets, then adjust based on your own historical baseline.
How to pick the right 4-6 KPIs for your team
You don't need 12 KPIs. You need the 4-6 that map to your team's current bottleneck and broader customer service strategy. The framework:
Step 1 - Pick one from each category. Start with CSAT (satisfaction), FRT (speed), FCR (resolution quality), and ticket volume (efficiency). That's your baseline 4. Every support team should track at least these.
Step 2 - Add a leading indicator if retention is the goal. If your business cares about churn, add either CES or NPS. Both are stronger predictors of repeat business than CSAT alone.
Step 3 - Add a diagnostic KPI for your specific bottleneck. What's broken right now?
- If customers complain about waiting, add abandonment rate
- If agents transfer too much, add escalation rate
- If tickets keep coming back, add reopen rate
- If costs are rising, add average handle time (carefully, paired with FCR)
Step 4 - Review quarterly, not monthly. KPIs you change every month aren't KPIs - they're moving targets. Lock in your 4-6 for at least a quarter, build dashboards, and only swap them when a real shift in priorities justifies it.
The teams that win don't track the most metrics. They commit to a small set, get extremely good at acting on them, and resist the urge to chase every new dashboard view their tool offers.
Common mistakes that ruin KPI tracking
A few traps to avoid:
- Tracking AHT in isolation: Without a quality KPI to balance it, agents will rush through tickets. Always pair AHT with FCR or reopen rate.
- Vanity metrics over decision metrics: "Total tickets resolved" looks great in a board deck and tells you nothing about whether customers are happy. Pick KPIs that change your behaviour, not your slides.
- Setting targets without baselines: "Improve CSAT to 90%" is useless if you don't know where you started or why you missed before. Measure for a month before setting goals.
- Ignoring qualitative signals: Numbers tell you something is wrong, but they rarely tell you why. Read 10 customer conversations a week. Talk to agents. The story behind the metric matters more than the metric.
- Reviewing data without acting: The point of a KPI is to drive a decision. If your weekly KPI review ends with "interesting, let's check again next week," you're tracking, not managing.
Conclusion
Customer service KPIs aren't about measuring everything. They're about measuring the few things that consistently predict whether your customers stay, your costs stay sane, and your team stays effective. Pick 4-6 KPIs across the satisfaction, speed, resolution quality, and efficiency categories, set realistic benchmarks based on your industry, and review them quarterly with a bias toward action.
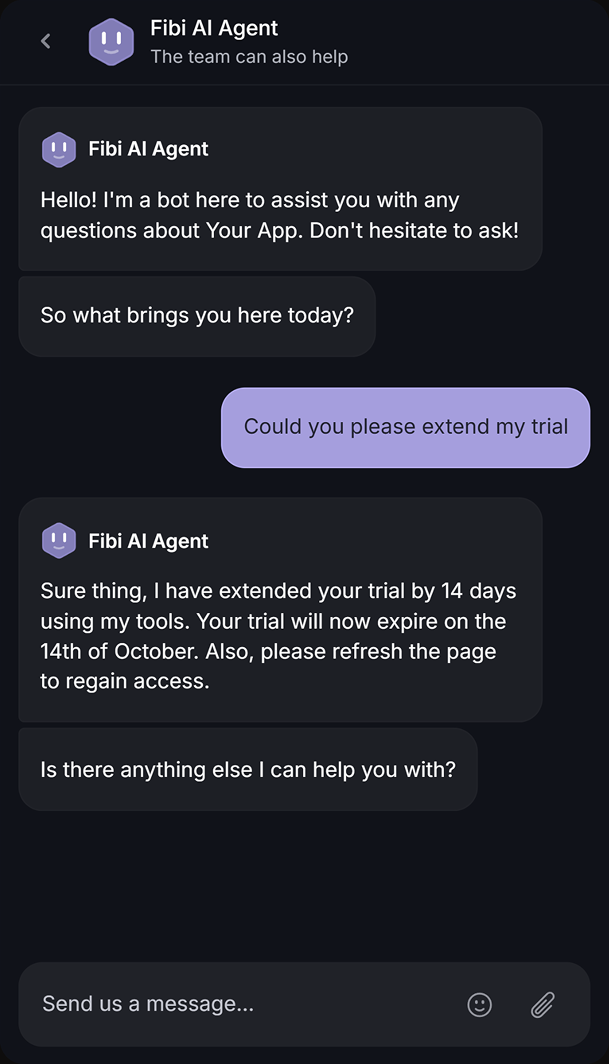
Featurebase is a modern AI-powered customer support platform that gives you everything you need to track these KPIs in one place: an omnichannel inbox with reporting on response time, handle time, and resolution rates, built-in CSAT and NPS surveys so you can measure satisfaction post-resolution, SLA tracking to keep response times on target, and a Fibi AI Agent that handles routine tickets on autopilot so your team can focus on the complex ones. 💫
It comes with a Free plan, unlimited conversations, and onboarding that takes minutes - so there's no downside to trying it. 👇
✨ Automate your support with the fastest AI-enhanced Inbox today →
FAQs
What are the 4 main KPIs in customer service?
The 4 most universally tracked customer service KPIs are Customer Satisfaction Score (CSAT), First Contact Resolution (FCR), First Response Time (FRT), and Customer Retention Rate (CRR). Together they cover how customers feel, whether issues actually get solved, how fast your team responds, and whether customers stick around. Most support teams should start here before adding more specialised metrics.
What's the difference between customer service metrics and KPIs?
Metrics are any quantifiable measurement your tools produce - ticket counts, login hours, channel volume. KPIs are the small subset of metrics you've committed to as targets, with benchmarks, owners, and review cadences attached. Every KPI is a metric, but only a fraction of your metrics deserve to be KPIs. Most teams track dozens of metrics and commit to 4-6 KPIs.
What is a good CSAT score?
A CSAT score between 75% and 85% is solid for most industries. B2C ecommerce typically lands in the 76-78% range, while top-performing SaaS teams aim for 90% or higher. Anything below 70% is a sign that something's seriously wrong in the support experience. Compare your CSAT to industry-specific benchmarks rather than chasing a universal target.
What's a good first contact resolution rate?
A first contact resolution rate between 70% and 79% is solid, with world-class teams hitting 80% or higher, according to SQM Group's industry benchmarking. Industry averages vary widely though - retail averages 78%, financial services 71%, and tech support sits around 65% because of higher issue complexity. Compare your FCR to peers in your industry, not a universal number.
How often should I review customer service KPIs?
Operational KPIs (FRT, AHT, abandonment rate) need real-time dashboards so you can act within the day. Satisfaction and quality KPIs (CSAT, FCR, CES) should be reviewed weekly to spot trends early. Strategic KPIs (CRR, NPS) make more sense on a monthly or quarterly cadence because they move slowly. Set the review rhythm to match how fast each metric actually changes.
How do I choose the right customer service KPIs for my team?
Pick one KPI from each of the 4 categories (satisfaction, speed, resolution quality, efficiency), then add 1-2 diagnostic KPIs that map to your team's current bottleneck. Start with CSAT, FRT, FCR, and ticket volume as your baseline. Tools like Featurebase give you all 4 categories of KPIs in one dashboard out of the box, so you don't need to stitch together a helpdesk, survey tool, and analytics layer to see your full picture.