Blog Customer ServiceLive Chat Metrics: 12 KPIs Worth Tracking
Live Chat Metrics: 12 KPIs Worth Tracking
Track the 12 live chat metrics that actually tell you something - what each one means, a sane benchmark, and how to move it.


✨ Automate your support with the fastest AI-enhanced Inbox today →
You turned on live chat, the conversations are rolling in, and the dashboard is full of numbers. But are those numbers any good?
That's the hard part. Track everything and you learn nothing. Track the wrong things and you optimize for the wrong outcome.
So here are the 12 live chat metrics worth your attention, grouped into 4 plain-English buckets, with what each one is really telling you and how to improve it. 👇
Key takeaways:
- Live chat metrics fall into 4 buckets: speed, volume, quality, and satisfaction. You need a mix from each to see the full picture.
- Speed drives satisfaction: it's the single biggest factor in how customers rate a chat, but a fast reply means little if the issue never gets resolved.
- Never read a metric in isolation: a low resolution time looks great until you notice CSAT dropped with it.
- Benchmarks are a starting point, not a target: your "good" depends on your industry, your product, and how complex your chats are.
- The easiest way to track all of this is in one place. Featurebase✨ gives you an omnichannel inbox, post-chat CSAT and NPS surveys, and SLA tracking without stitching spreadsheets together.
What are live chat metrics?
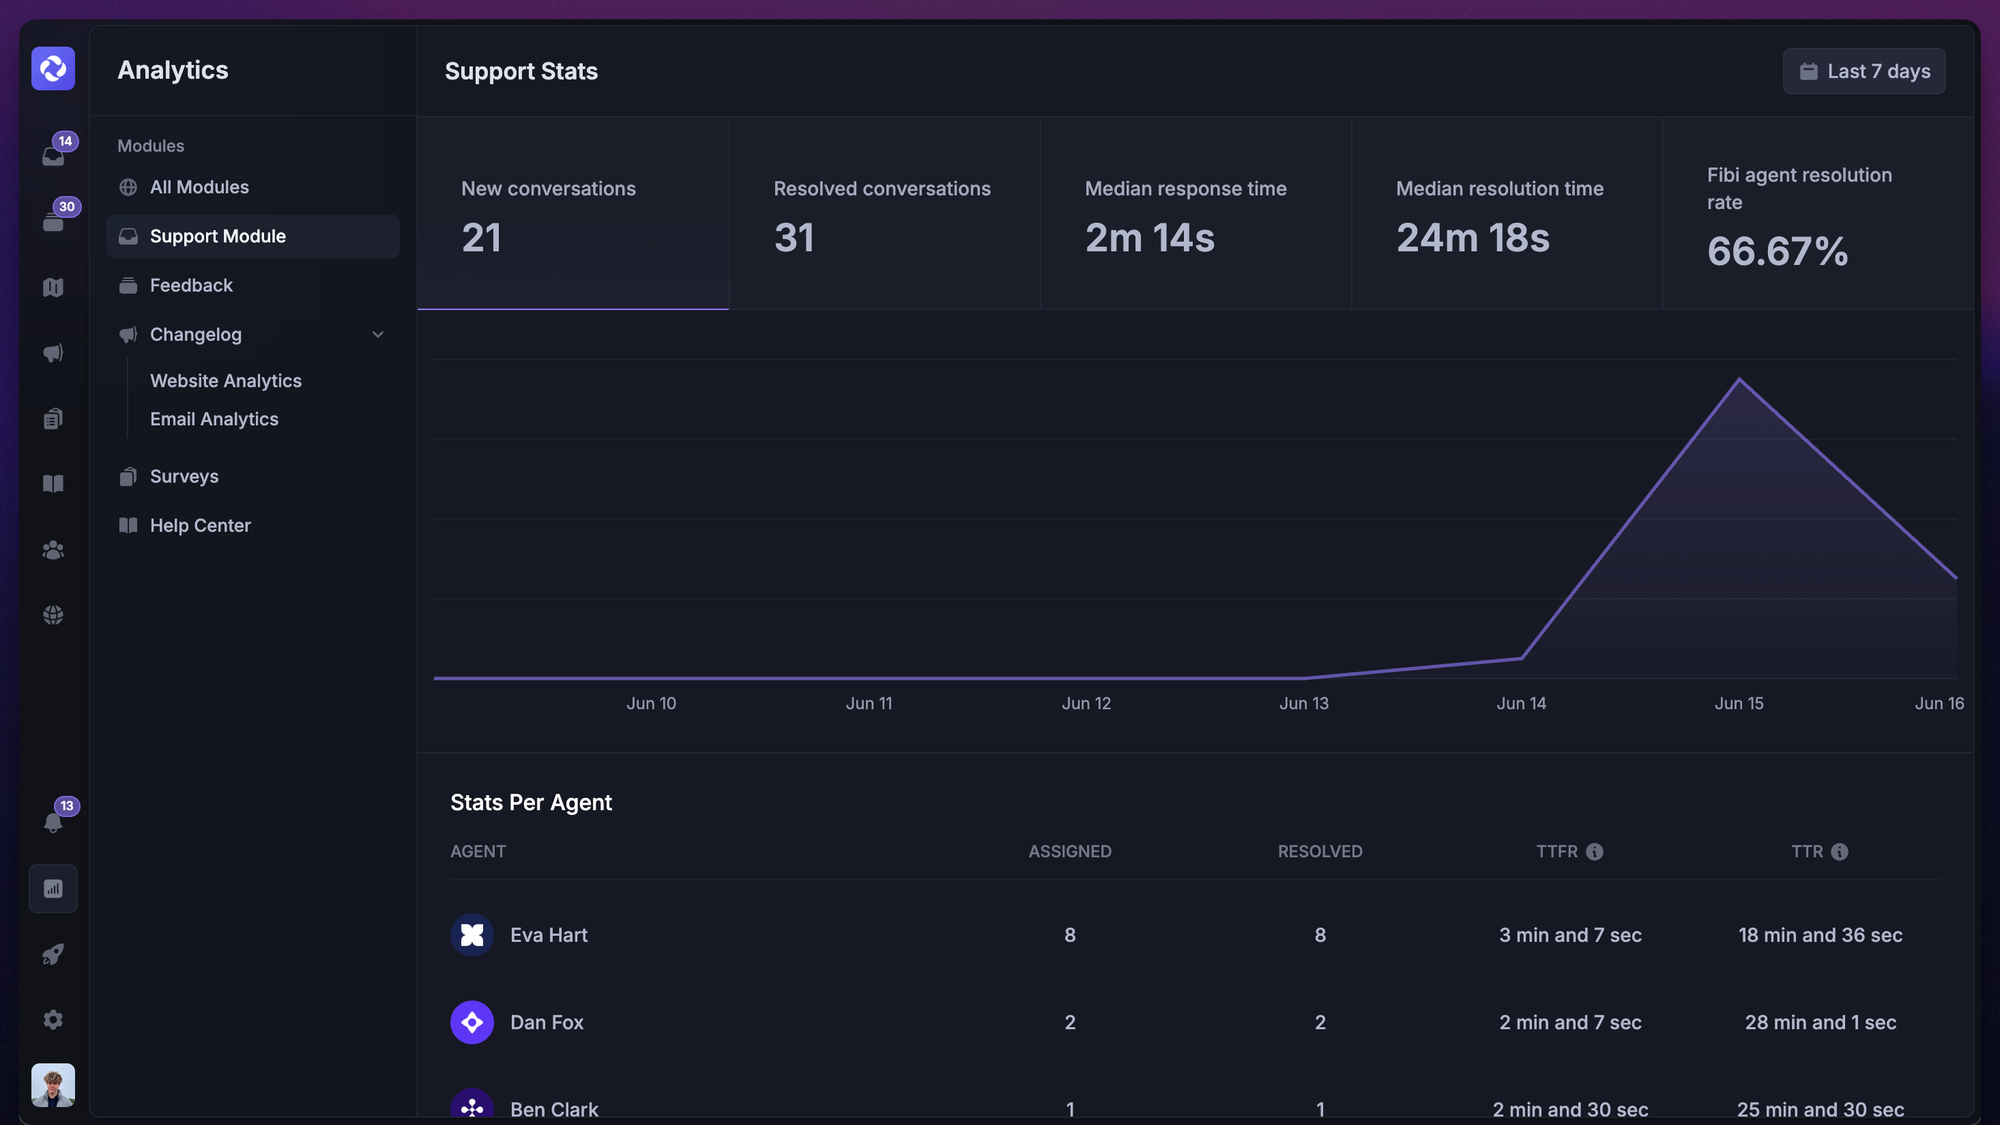
Live chat metrics are the numbers that measure how well your live chat support is performing - how fast you reply, how often you resolve issues, how many chats you handle, and how happy customers are at the end.
On their own, they're just data. The value comes from watching them over time and reading them together, so you can spot what's working and fix what isn't.
A quick distinction worth making, since people use these words interchangeably:
- A metric is anything you can measure - response time, chat volume, transfer rate, and so on.
- A KPI is the small set of metrics you've decided actually reflect your goals. Every KPI is a metric, but not every metric earns KPI status.
Pick too many KPIs and your team loses focus. The 12 below are the ones most support teams find worth tracking. Treat them as a menu, not a checklist - your customer service KPIs should match what you're actually trying to improve.
Speed and responsiveness metrics
Speed is usually the first thing customers notice and the single biggest driver of how they rate the chat. These 3 metrics tell you how quickly you reply and resolve.
First response time (FRT)
First response time measures how long a customer waits between sending their first message and getting a reply from an agent. It sets the tone for the entire conversation.
This is the metric customers feel most. They chose live chat because they expected "live," so a slow first reply breaks the promise before the conversation even starts.
A solid target is under a minute, and the best teams reply in under 40 seconds. Speed matters even more on sales chats, where a shopper with a question is often a purchase waiting to happen.
How to improve it:
- Use canned responses for common openers so agents aren't typing the same thing all day.
- Let agents handle a few chats at once instead of one at a time.
- Put a chatbot in front to greet instantly and triage before a human steps in.
Average response time
First response time only covers the opening reply. Average response time measures how long customers wait for every reply across the whole conversation.
It matters because customers expect the speed to hold up. A 20-second first reply followed by 4-minute gaps feels worse than a steady, predictable pace throughout.
If this number creeps up, agents are usually juggling too many chats at once, or hunting for information they should have at their fingertips.
Average resolution time
Average resolution time is how long it takes to fully solve a customer's issue, from the first message to the moment it's marked resolved. It's your clearest read on efficiency.
But faster isn't automatically better. A customer who gets a careful, complete answer in 8 minutes often leaves happier than one rushed to a half-answer in 3. Watch this number alongside satisfaction, never on its own.
To bring it down without hurting quality, give agents a solid knowledge base to pull from, route chats to the right person the first time, and lean on saved replies for routine questions.
Volume and availability metrics
These metrics tell you how much demand you're getting and whether your team can actually keep up with it.
Chat volume
Chat volume is the total number of chats you receive in a given period. It's the foundation for staffing, forecasting, and spotting problems early.
On its own it's just a count. Read in context, it's a signal. A spike in chats about one topic usually means something on your site is unclear or broken. A sudden drop can mean your chat widget isn't loading.
Track it by day and hour so you can staff for your real peaks instead of guessing.
Missed chat rate
Missed chat rate is the share of chats that never get answered before the customer gives up and leaves. Making someone wait is one thing. Ignoring them entirely is worse.
A consistently high rate points to one of 2 things: not enough agents during busy windows, or chat being left open when nobody's actually available.
Keep it under 5%, and under 3% if you can. To get there, deflect repetitive questions with a chatbot or self-service knowledge base, and set clear chat hours if round-the-clock coverage isn't realistic. Proactive chat invitations also help by setting expectations before someone reaches out.
Chats per agent
Chats per agent measures the average workload each agent carries, whether over a day, a month, or at the same time (concurrency). It tells you if your team is stretched too thin or has room to spare.
The trick is reading it against quality. A high number alongside falling CSAT means your team is overloaded, and burnout usually follows. A low number with quiet queues might mean you're overstaffed.
Most agents comfortably handle 2 to 4 live chats at once, depending on how complex the questions are. Push past that and reply times slip.
Resolution and quality metrics
Speed gets attention, but quality is what actually solves the customer's problem. These metrics show whether your chats are genuinely resolving issues.
First contact resolution (FCR)
First contact resolution is the percentage of chats fully solved in a single conversation, with no follow-up needed. It's one of the strongest predictors of a happy customer.
High effort is the silent killer of loyalty here. In the research behind The Effortless Experience, 96% of customers who had a high-effort experience became more disloyal afterward, compared to just 9% of those with a low-effort one. Every extra follow-up is more effort you're putting on the customer.
Aim for 70% or higher, with 80%+ being excellent. The way up is better agent training, an easy-to-search knowledge base, and good quality assurance so you can see where chats fall apart.
Transfer rate
Transfer rate is the share of chats handed off to another agent or team mid-conversation. A few transfers are normal, but a lot of them signal friction.
A high rate usually means chats aren't reaching the right person first, or agents aren't equipped to handle the range of questions coming in. Either way, the customer pays for it by repeating themselves.
Tighten your routing so chats land in the right place, and build clear escalation paths so agents know exactly when and where to hand off.
Average chat duration
Average chat duration is how long a typical conversation lasts from start to finish. It hints at how complex your chats are and how efficiently agents move through them.
There's no universal "good" number here. A longer chat can mean a thorough, reassuring conversation or an agent stuck searching for an answer. Context decides which.
Use it to spot outliers rather than chase a target. If durations suddenly climb, dig into why before assuming agents are slow.
Satisfaction and business-impact metrics
At the end of the day, the metrics that matter most are whether customers were happy and whether chat moved your business forward.
Customer satisfaction (CSAT)
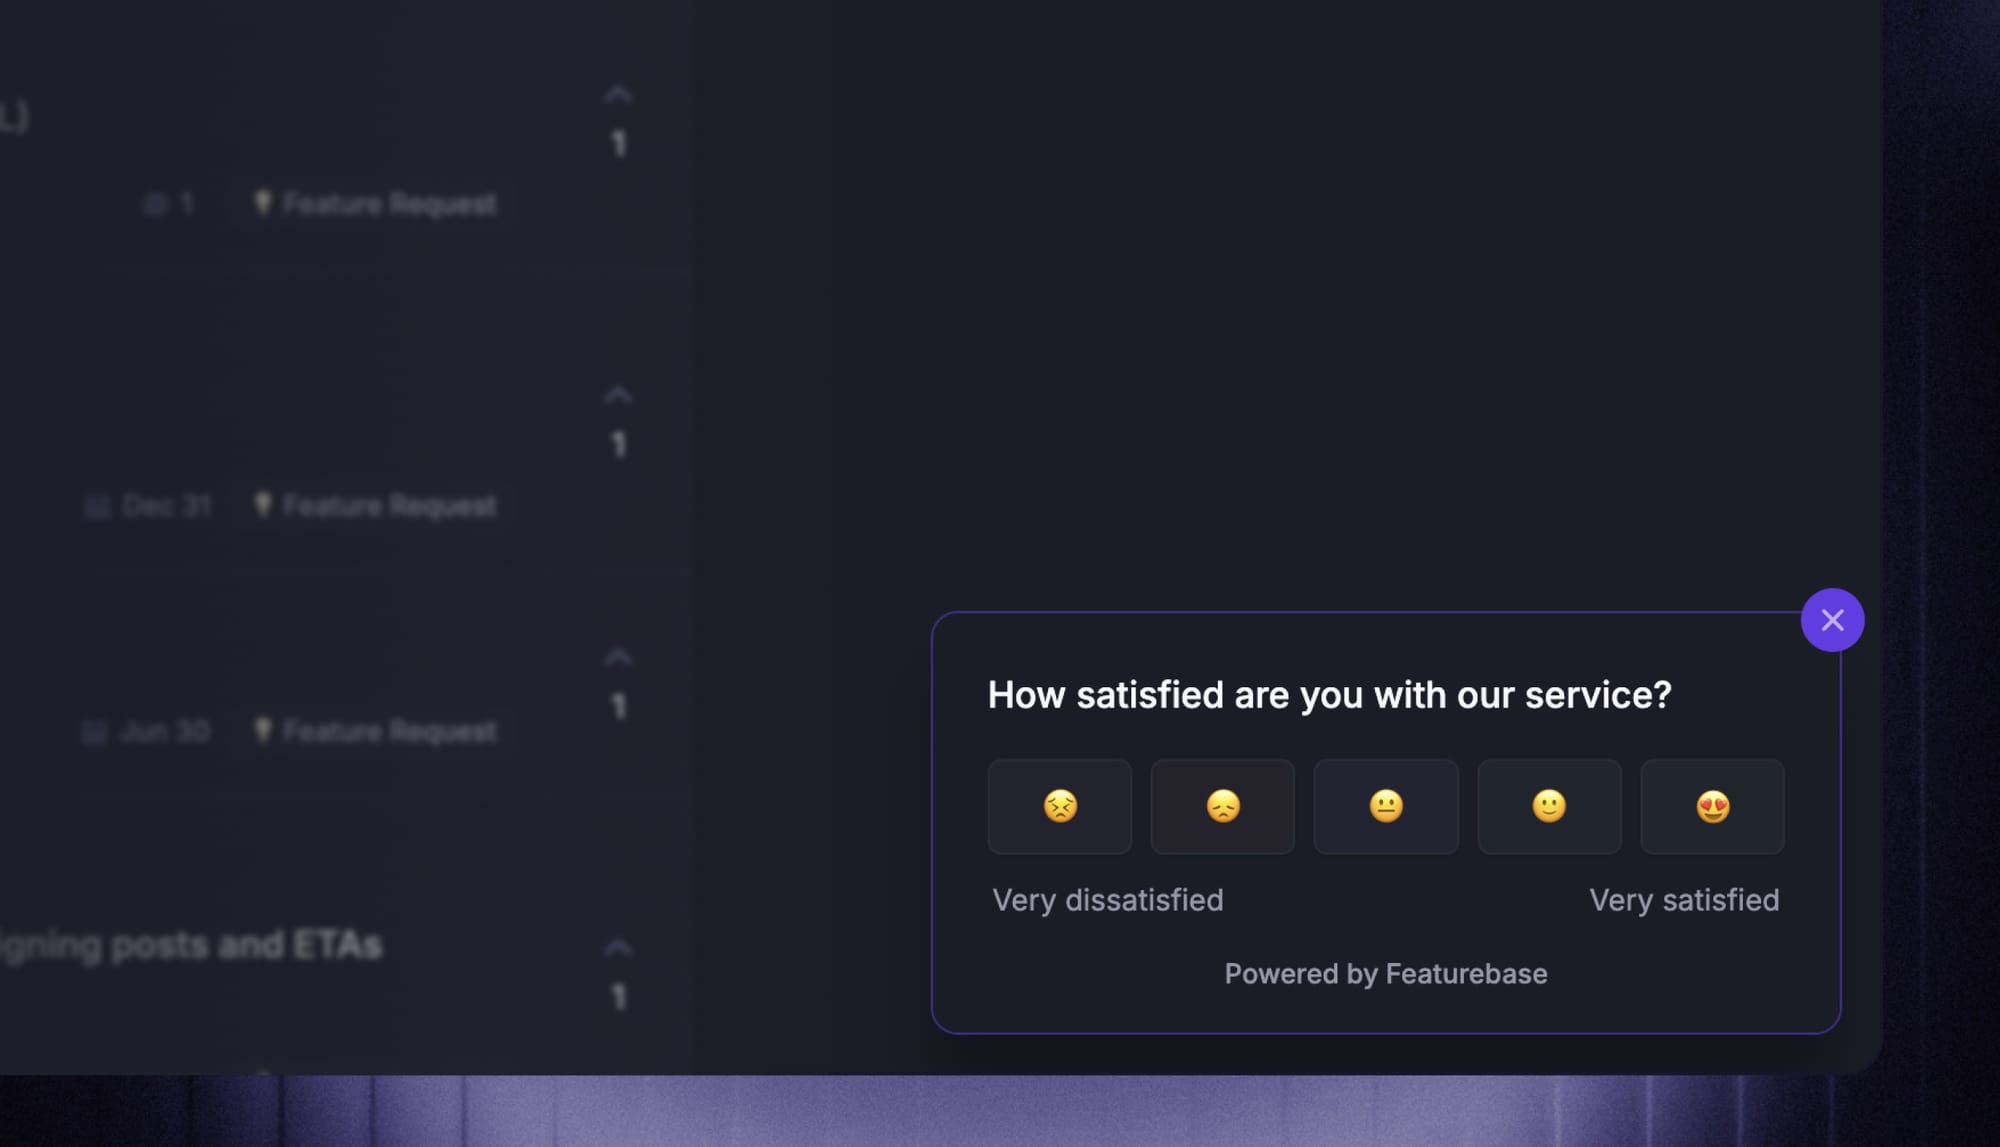
CSAT measures how satisfied customers are with a specific chat, usually through a quick 1-question survey right after the conversation ends. It's the most direct read on quality you can get.
Because you ask in the moment, the feedback is fresh and specific. A run of low scores about one topic or one shift tells you exactly where to look.
Send the survey automatically at the end of every chat, then actually read the comments. The number tells you something's wrong. The comments tell you what.
Net Promoter Score (NPS)
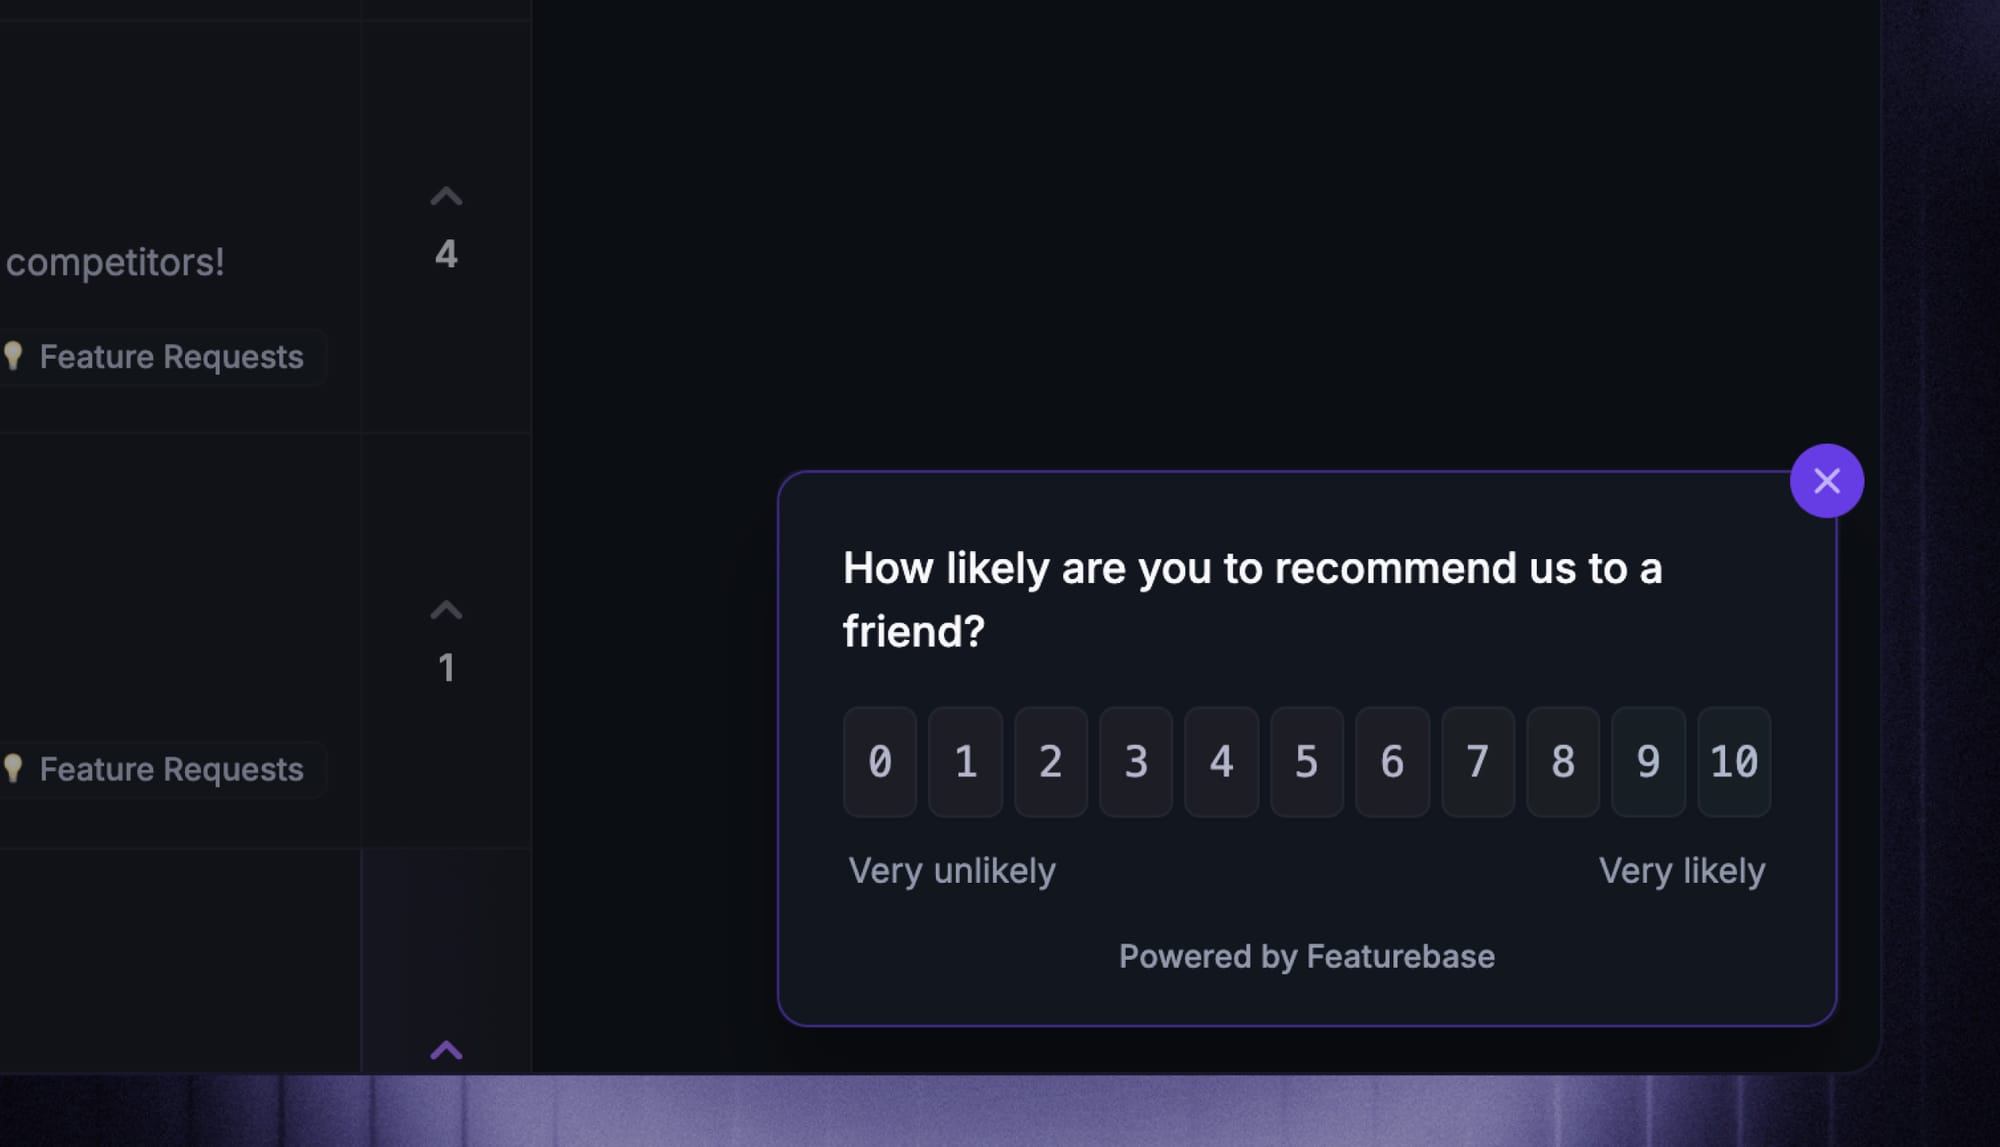
While CSAT measures one interaction, NPS measures loyalty to your whole brand by asking how likely someone is to recommend you. It's a wider, longer-term signal.
Responses sort into 3 groups:
- Promoters (9 to 10) - loyal fans who'll recommend you.
- Passives (7 to 8) - satisfied but not enthusiastic.
- Detractors (0 to 6) - unhappy customers at risk of churning or leaving bad reviews.
Your score is the percentage of promoters minus the percentage of detractors. A live chat right after a great interaction is a natural moment to ask. If a single transactional score feels too blunt, it's worth looking at NPS alternatives that capture effort or satisfaction instead.
Chat-to-conversion rate
Chat-to-conversion rate is the percentage of chats that lead to a purchase or signup within a set window, usually 24 to 48 hours. It's what proves chat is a revenue driver, not just a cost center.
This is the metric that gets support a seat at the revenue table. When you can show that customers who chat convert at a higher rate, live chat stops looking like an expense.
To lift it, trigger proactive chats on high-intent pages like pricing and checkout, and make sure agents can answer the questions that stand between a visitor and a "yes."
How to read your live chat metrics together
The biggest mistake teams make is judging metrics one at a time. Almost every number above can be gamed in a way that quietly hurts another.
A few examples of how they pull on each other:
- Cut resolution time too hard and FCR and CSAT often drop, because agents close chats before fully solving them.
- Push chats-per-agent up and response times usually slip, because everyone's stretched thin.
- Celebrate a high deflection rate without checking bot CSAT, and you might just be frustrating people faster.
The fix is to always pair an efficiency metric with a quality one. Speed next to satisfaction. Volume next to missed chats. That's how you tell real improvement from a number that only looks better. Build it into your customer service strategy so the whole team reads the dashboard the same way.
How to actually track these metrics
Most of this falls apart when your live chat lives in one tool, your surveys in another, and your reporting in a spreadsheet someone updates on Fridays. The numbers go stale and nobody trusts them. Before you commit to a tracking setup, look for a few things:
- Built-in reporting: speed, volume, and resolution metrics should be calculated for you, not exported and pivoted by hand. Manual math is where tracking quietly dies.
- Post-chat surveys: CSAT and NPS only work if the survey fires automatically at the end of a conversation, while the experience is fresh.
- One place for every channel: if chat, email, and other channels report separately, you can't compare them or see your real workload.
- SLA tracking: alerts when a chat is about to breach your response-time target turn metrics from a postmortem into something you can act on live.
If you're already shopping for a tool, this is also where an omnichannel support platform earns its keep, since it keeps chat, surveys, and reporting under one roof. Featurebase is one option built for product-led SaaS teams: it pairs a shared inbox with post-chat CSAT and NPS surveys and SLA tracking, so first response time, satisfaction, and missed chats sit on the same screen.
Conclusion
Live chat metrics only earn their keep when you track the right few and read them together. Speed tells you how responsive you are, volume tells you if you can keep up, quality tells you if you're actually solving problems, and satisfaction tells you if any of it landed. No single number wins on its own.
Featurebase is a modern AI-powered support platform that brings live chat, an AI help center, CSAT and NPS surveys, and SLA tracking together in one place. Instead of stitching tools together, you get every live chat metric that matters in a single, modern inbox.
It comes with a Free plan and the onboarding is quick with no credit card required, so there's no downside to trying it. 👇
✨ Automate your support with the fastest AI-enhanced Inbox today →
FAQs
What's the difference between a live chat metric and a KPI?
A metric is any number you can measure, like response time or chat volume. A KPI is the small set of metrics you've chosen because they reflect your support goals. Every KPI is a metric, but you only promote a metric to KPI status when hitting it genuinely means you're succeeding.
What is a good first response time for live chat?
Under a minute is a solid target, and the best teams reply in under 40 seconds. Speed matters most on sales-oriented chats, where a quick reply can be the difference between a sale and an abandoned cart. What counts as "good" still varies by industry and chat complexity, so track your own trend rather than chasing a universal number.
How many live chats can one agent handle at once?
Most agents comfortably handle 2 to 4 concurrent chats, depending on how complex the questions are. Simple, repetitive chats allow more, while technical or emotional ones need fewer. The best way to find your ceiling is to watch CSAT as concurrency rises - when satisfaction starts slipping, you've found the limit.
What's the difference between CSAT, NPS, and CES?
They measure 3 different things. CSAT captures how satisfied a customer was with one specific interaction, NPS measures long-term loyalty to your brand, and CES (customer effort score) measures how easy it was to get help. CSAT and CES are great for rating individual chats, while NPS is better for tracking overall sentiment over time.
How can AI improve live chat metrics?
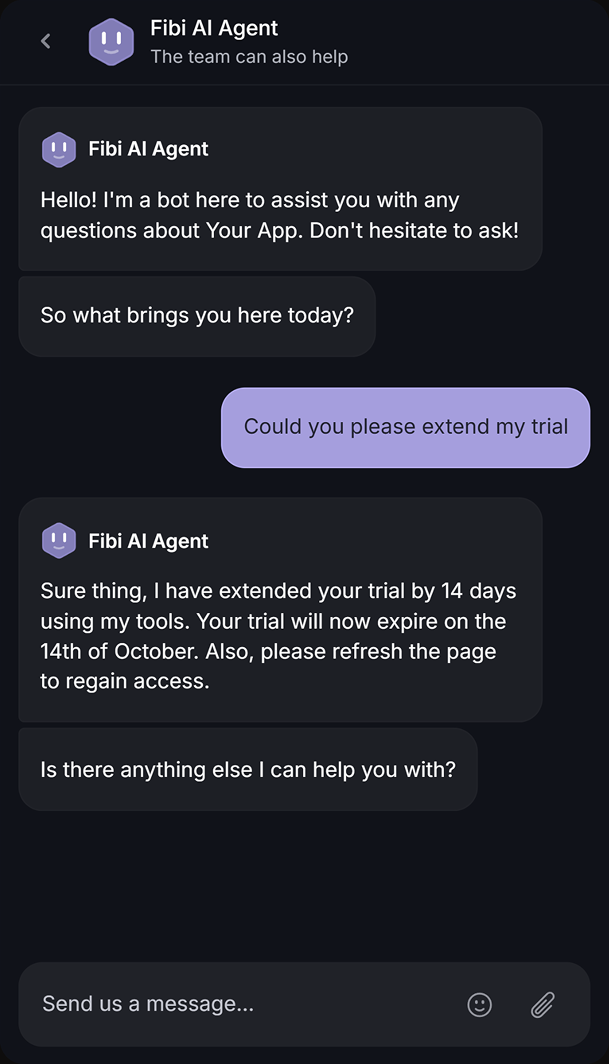
AI improves speed by answering common questions instantly, improves volume by deflecting repetitive chats away from agents, and provides 24/7 coverage that lowers missed chat rates. Featurebase's Fibi AI Agent, for example, resolves routine issues on autopilot so agents focus on complex chats. Just be sure to track bot CSAT alongside deflection rate, since automation that frustrates customers isn't really helping.
How often should you review your live chat metrics?
Review speed and volume metrics weekly so you can adjust staffing and catch problems early. Satisfaction metrics like CSAT and NPS are better looked at monthly, where trends are clearer and less noisy. Then do a deeper quarterly review to reset benchmarks and check that your KPIs still match your goals.