Blog Product ManagementRICE Score Framework: Definition, Template, and Prioritization Guide
RICE Score Framework: Definition, Template, and Prioritization Guide
Having a backlog full of feature ideas is great, but how do you decide which ones deserve your team's resources the most? The RICE score provides a data-driven framework to prioritize features with the most potential, ensuring your roadmap is strategically aligned with your goals.


💡 Free RICE score prioritization Excel template →
Having a backlog full of feature ideas is great, but it also creates a tough question: how do you decide which ideas deserve your team’s time, resources, and energy first?
You can’t always rely on gut feeling, especially when roadmap decisions affect customers, revenue, and product strategy. That’s where the RICE score comes in.
The RICE score is a prioritization method that helps product teams compare features and initiatives using four factors: reach, impact, confidence, and effort. Together, these factors make up the RICE framework, also known as the "RICE scoring model".
In this guide, we’ll explain what a RICE score is, how it works, how to use it, and how to apply the framework to prioritize your roadmap more confidently.👇
What is the RICE score framework?
The RICE framework is a product prioritization method used to evaluate features, projects, and initiatives based on their potential value and required effort. Basically, it's a handy decision-making tool for prioritizing tasks and stands for Reach, Impact, Confidence, and Effort.
You assign each factor a score and calculate a RICE score. Then, you can compare the RICE scores of different potential projects to quickly prioritize them.
It's created by Intercom’s product manager, Sean McBride, and adds ‘reach’ to the traditional ICE framework.
But how do you actually calculate a RICE score? It’s simple, just use this formula:
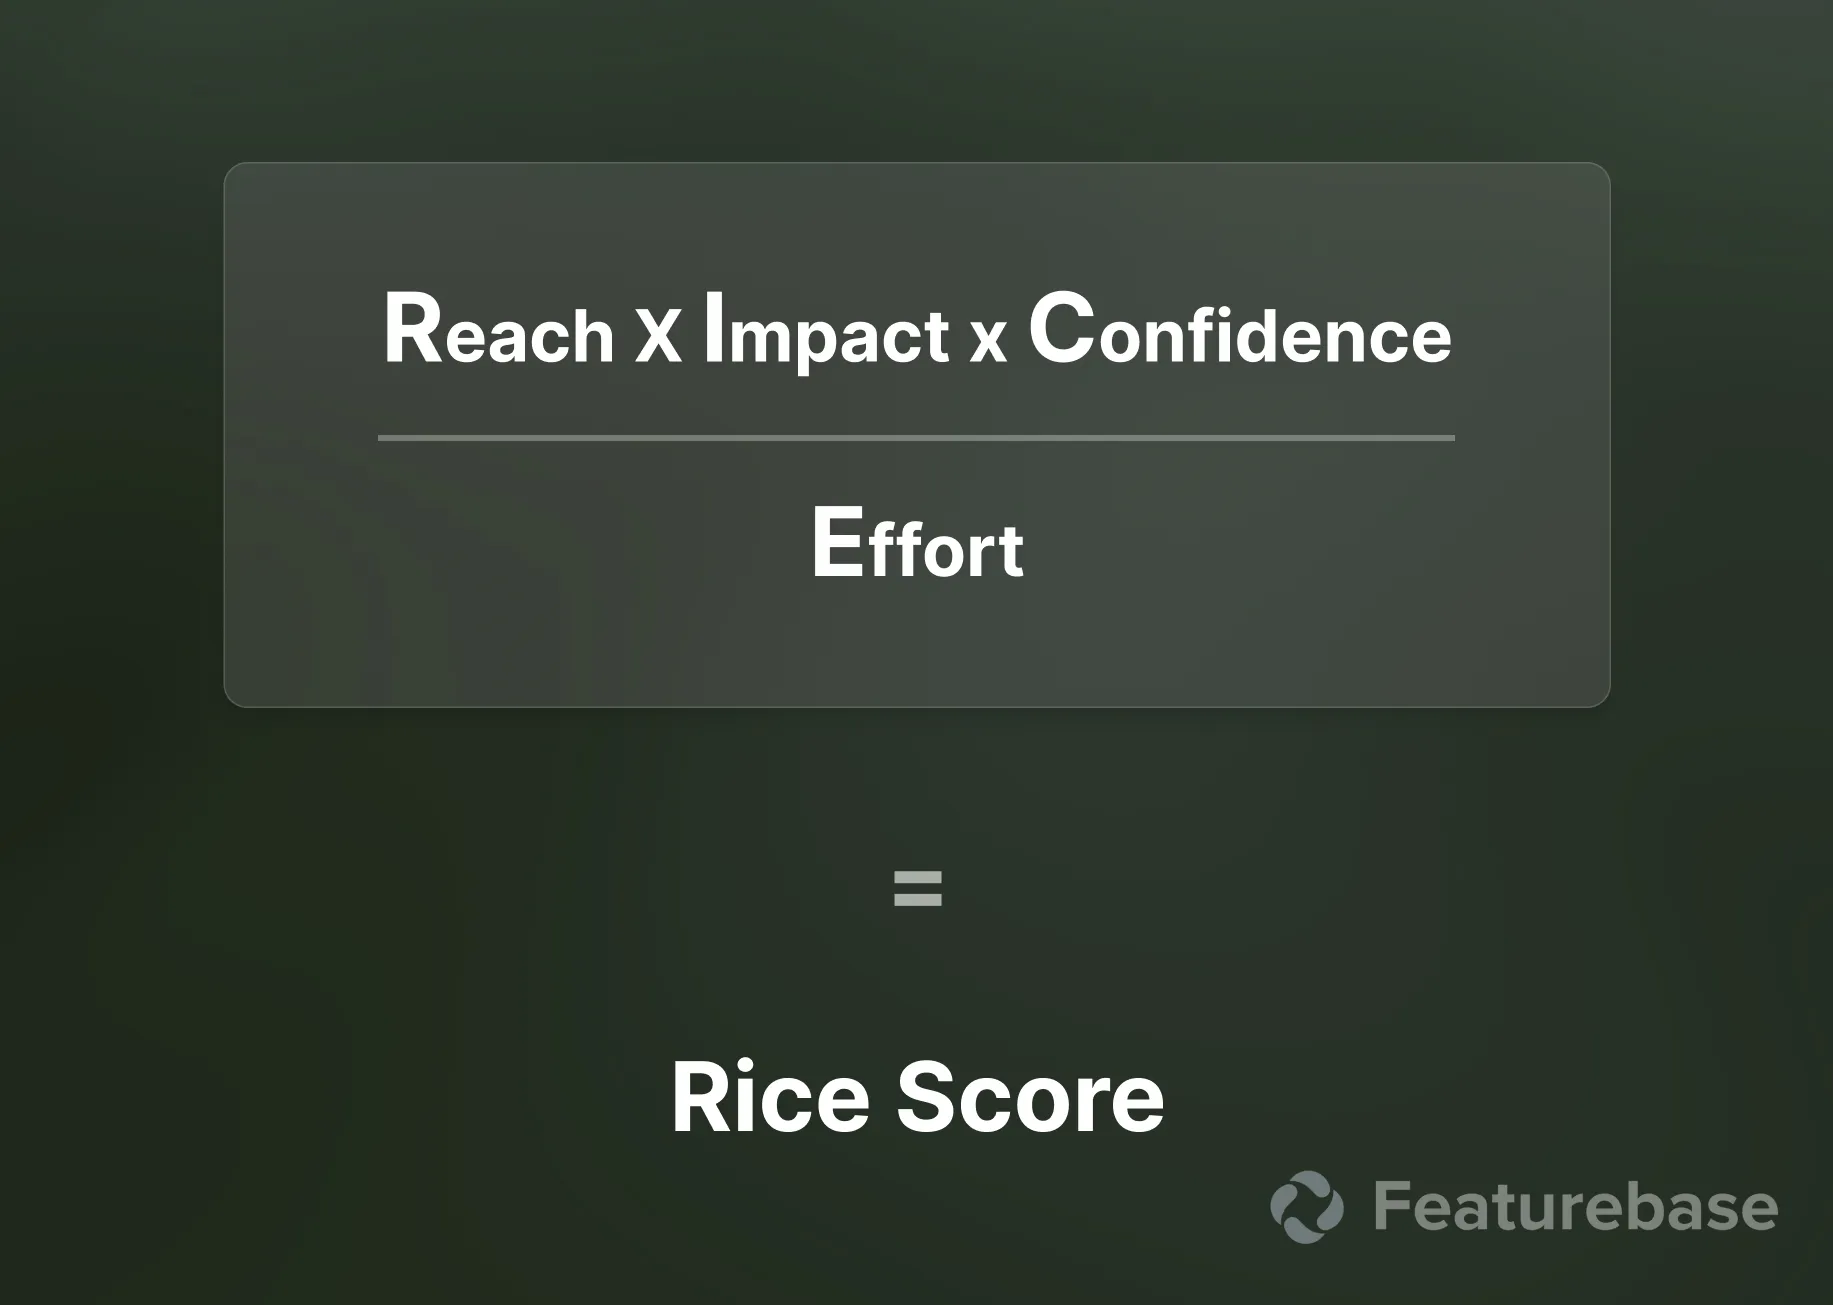
RICE Score = (Reach × Impact × Confidence) / Effort
A higher RICE score usually means an initiative has stronger potential because it can reach more users, create more impact, has higher confidence behind the estimate, or requires less effort.
However, the RICE score should not be treated as the only factor in roadmap planning. It works best as a starting point for product discussions, not as an automatic decision-maker.
To make sense of this calculation, let’s break down each factor:
Reach
Reach is the number of people your initiative or feature will impact within a specific time frame per quarter, month, or year.
Let’s say you want to add a new messaging feature to a mobile app with 50,000 monthly active users. Based on user surveys and historical data, you estimate that 40% of the users will use the new messaging feature. This means the feature's reach is 20,000 users per month.
Impact
Impact measures how much the project or feature will affect your users or your business.
This is usually subjective and is assigned a value on some scale—like this:
- 5 = Massive impact
- 4 = High impact
- 3 = Medium impact
- 2 = Low impact
- 1 = Minimal impact
For example, if you’re talking about a feature that almost 80% of beta testers have requested, you’d probably rate it a 5 (massive impact). On the other hand, a minor UI tweak might be rated as a 1 (minimal impact).
You can get as granular as you want with the scale. Just be mindful that more detailed scales require more granular analytics. If your analytics aren’t fine-tuned enough to distinguish between a 20 and a 22 on a 30-point scale, a 30-point scale is pointless.
Confidence
Confidence is your certainty about your reach, impact, and effort estimates. It helps account for uncertainty in your predictions.
We measure confidence as a percentage, ranging from 0-100:
- >80% (high confidence)
- 50% to 80% (medium confidence)
- >50% (low confidence)
The higher your confidence, the more certain you are about your estimates. For example, if you used a feature voting tool to estimate reach, you might have a confidence level of 90%. If data is sparse or based on assumptions, your confidence might be around 50%.
Effort
Finally, effort represents the work required to complete the project or feature. It’s typically measured in person-months (i.e., how many months it would take 1 person to complete a project).
This can be a bit confusing, so here’s a quick example to illustrate:
If it takes your team of 4 developers 1 month to complete a project, then the effort would be 4 person-months (1 month x 4 developers). If it takes your team 6 months to complete a project, then the effort would be 24 person-months (6 months x 4 developers).
✨ Start collecting & managing feedback with Featurebase for free →
How to use the RICE framework to prioritize features
1. Define the project or feature
The first step is to make a list of features you want to evaluate. This could be new features suggested by customers or ones you’ve had in your backlog for a while. The key is to ensure the features are:
- Feasible—you have the technical expertise to execute them.
- Aligned with your business goals.
- In demand by users.
Next, clearly define the goals you want to achieve with each feature. Are you aiming for:
- More customer retention
- Higher satisfaction
- Increased revenue
- or something else?
Knowing your goals now will be crucial when evaluating the "impact" in the next step.
2. Assign scores for each factor
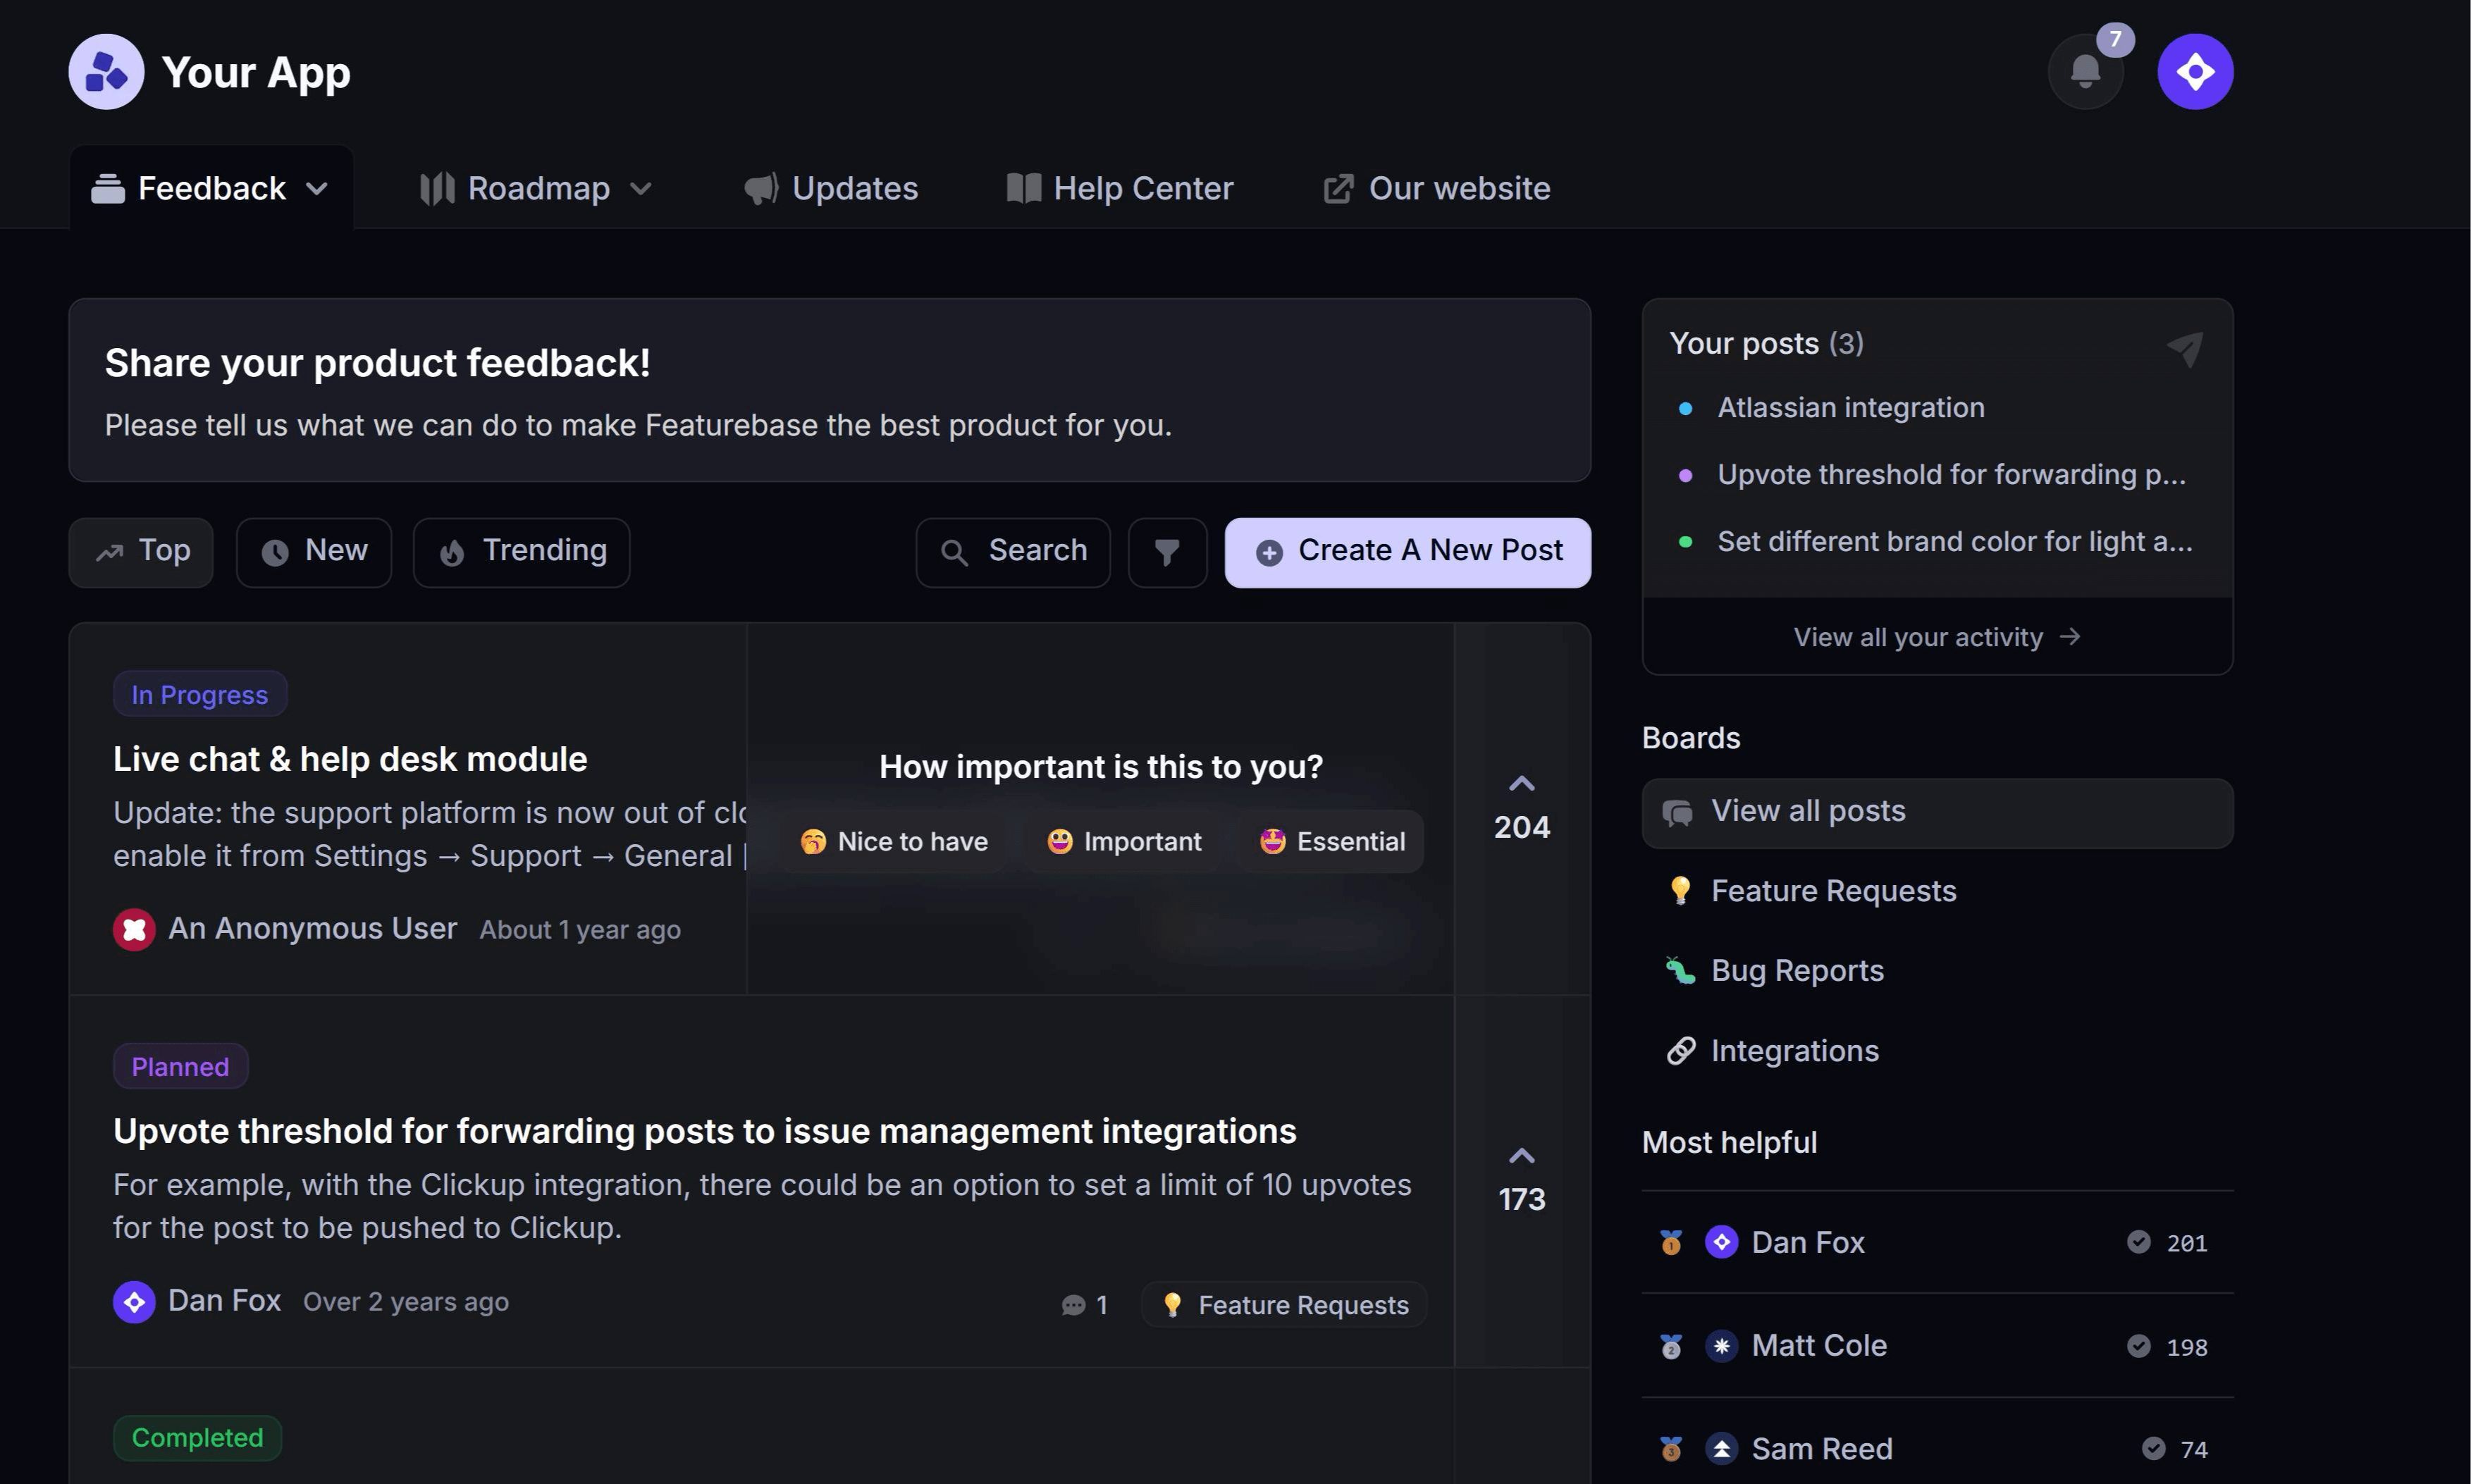
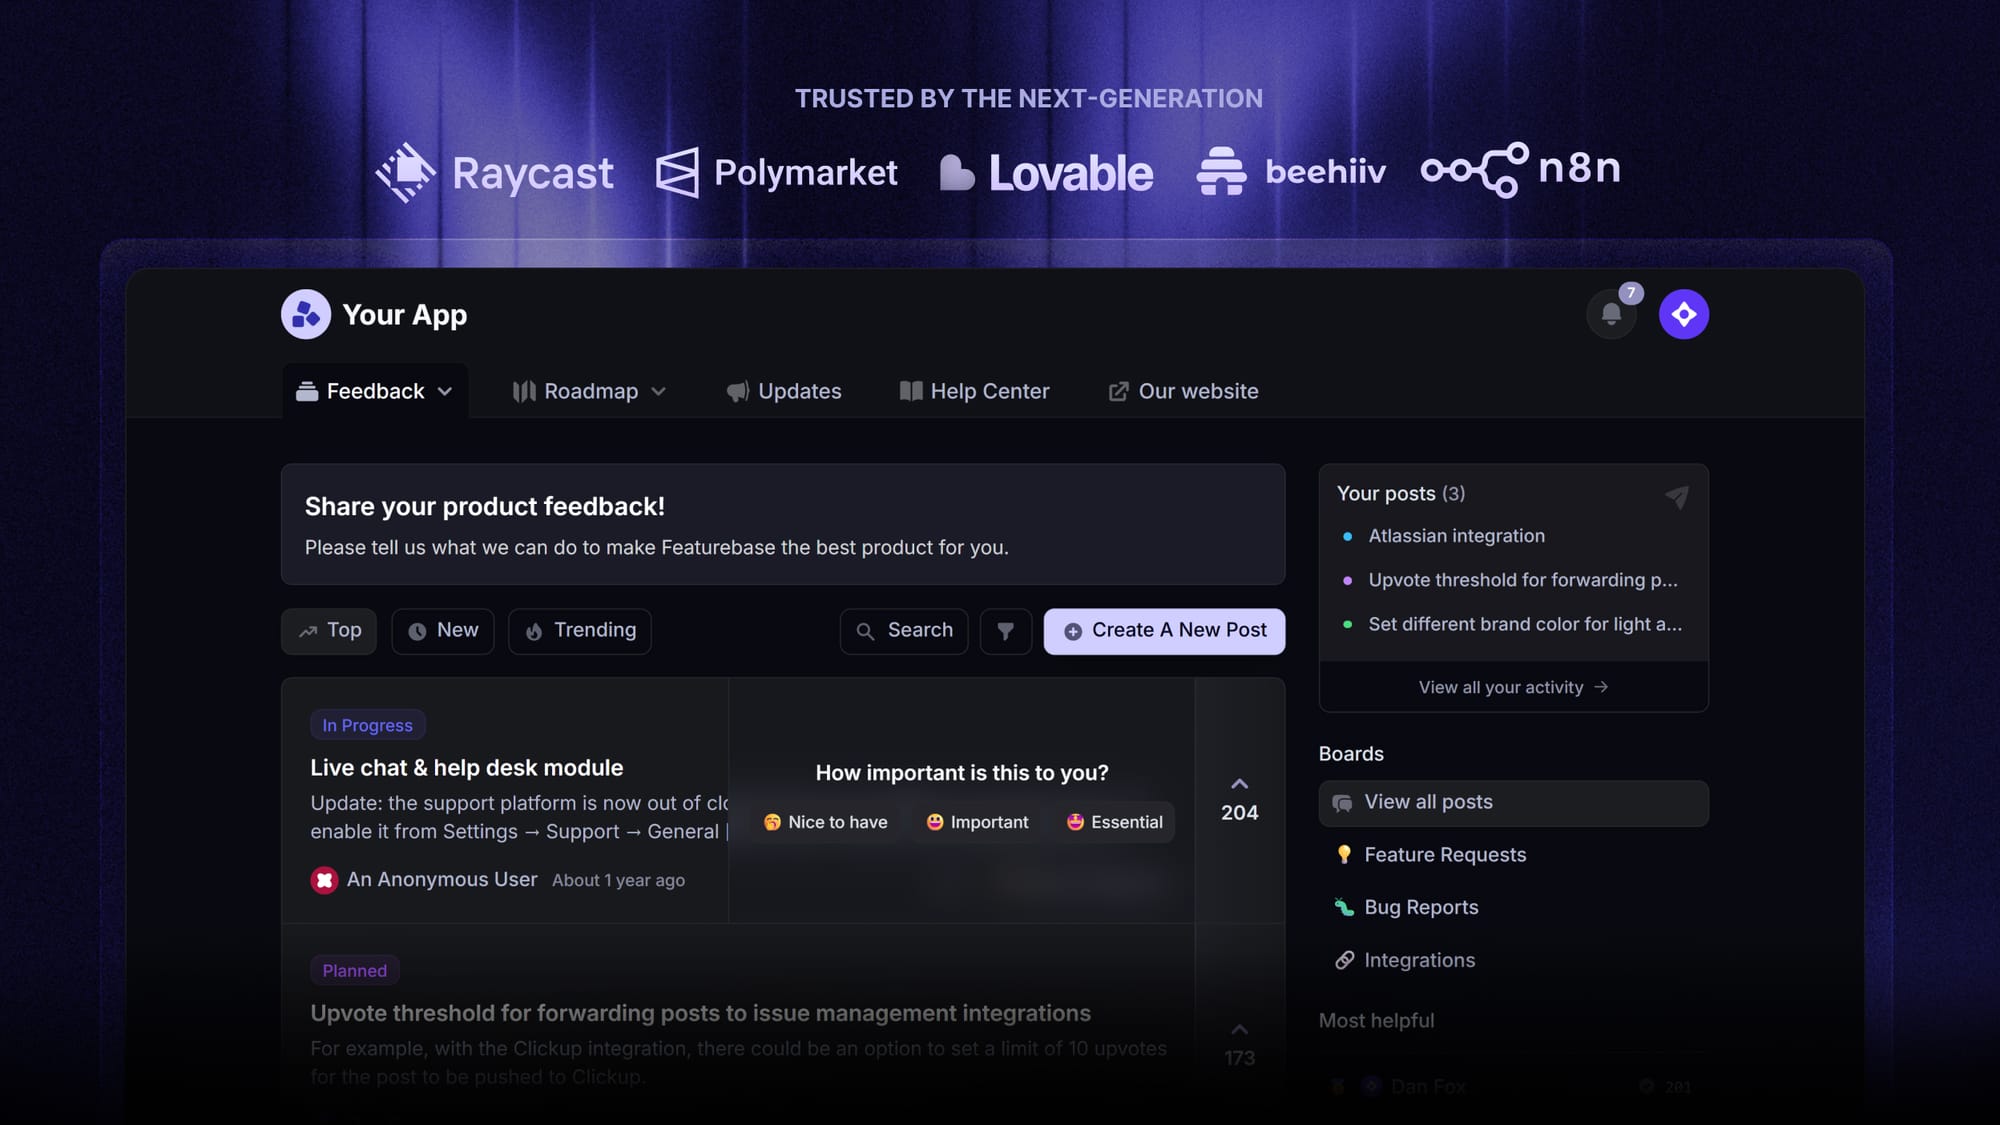
By now, you should have a good grasp of each factor, but the tricky part is finding actual numbers to plug in. This requires a bit of research on your end, but a customer feedback tool like Featurebase can make it a lot easier.
Here's how Featurebase can help you fill in each factor:
Reach
You can use Featurebase to run customer surveys and collect feedback. Ask your users questions that help you estimate how many people will be affected by the change. It could be a question like:
- "We're considering implementing a new feature that allows for [a brief description of the change]. How likely are you to use this feature?"
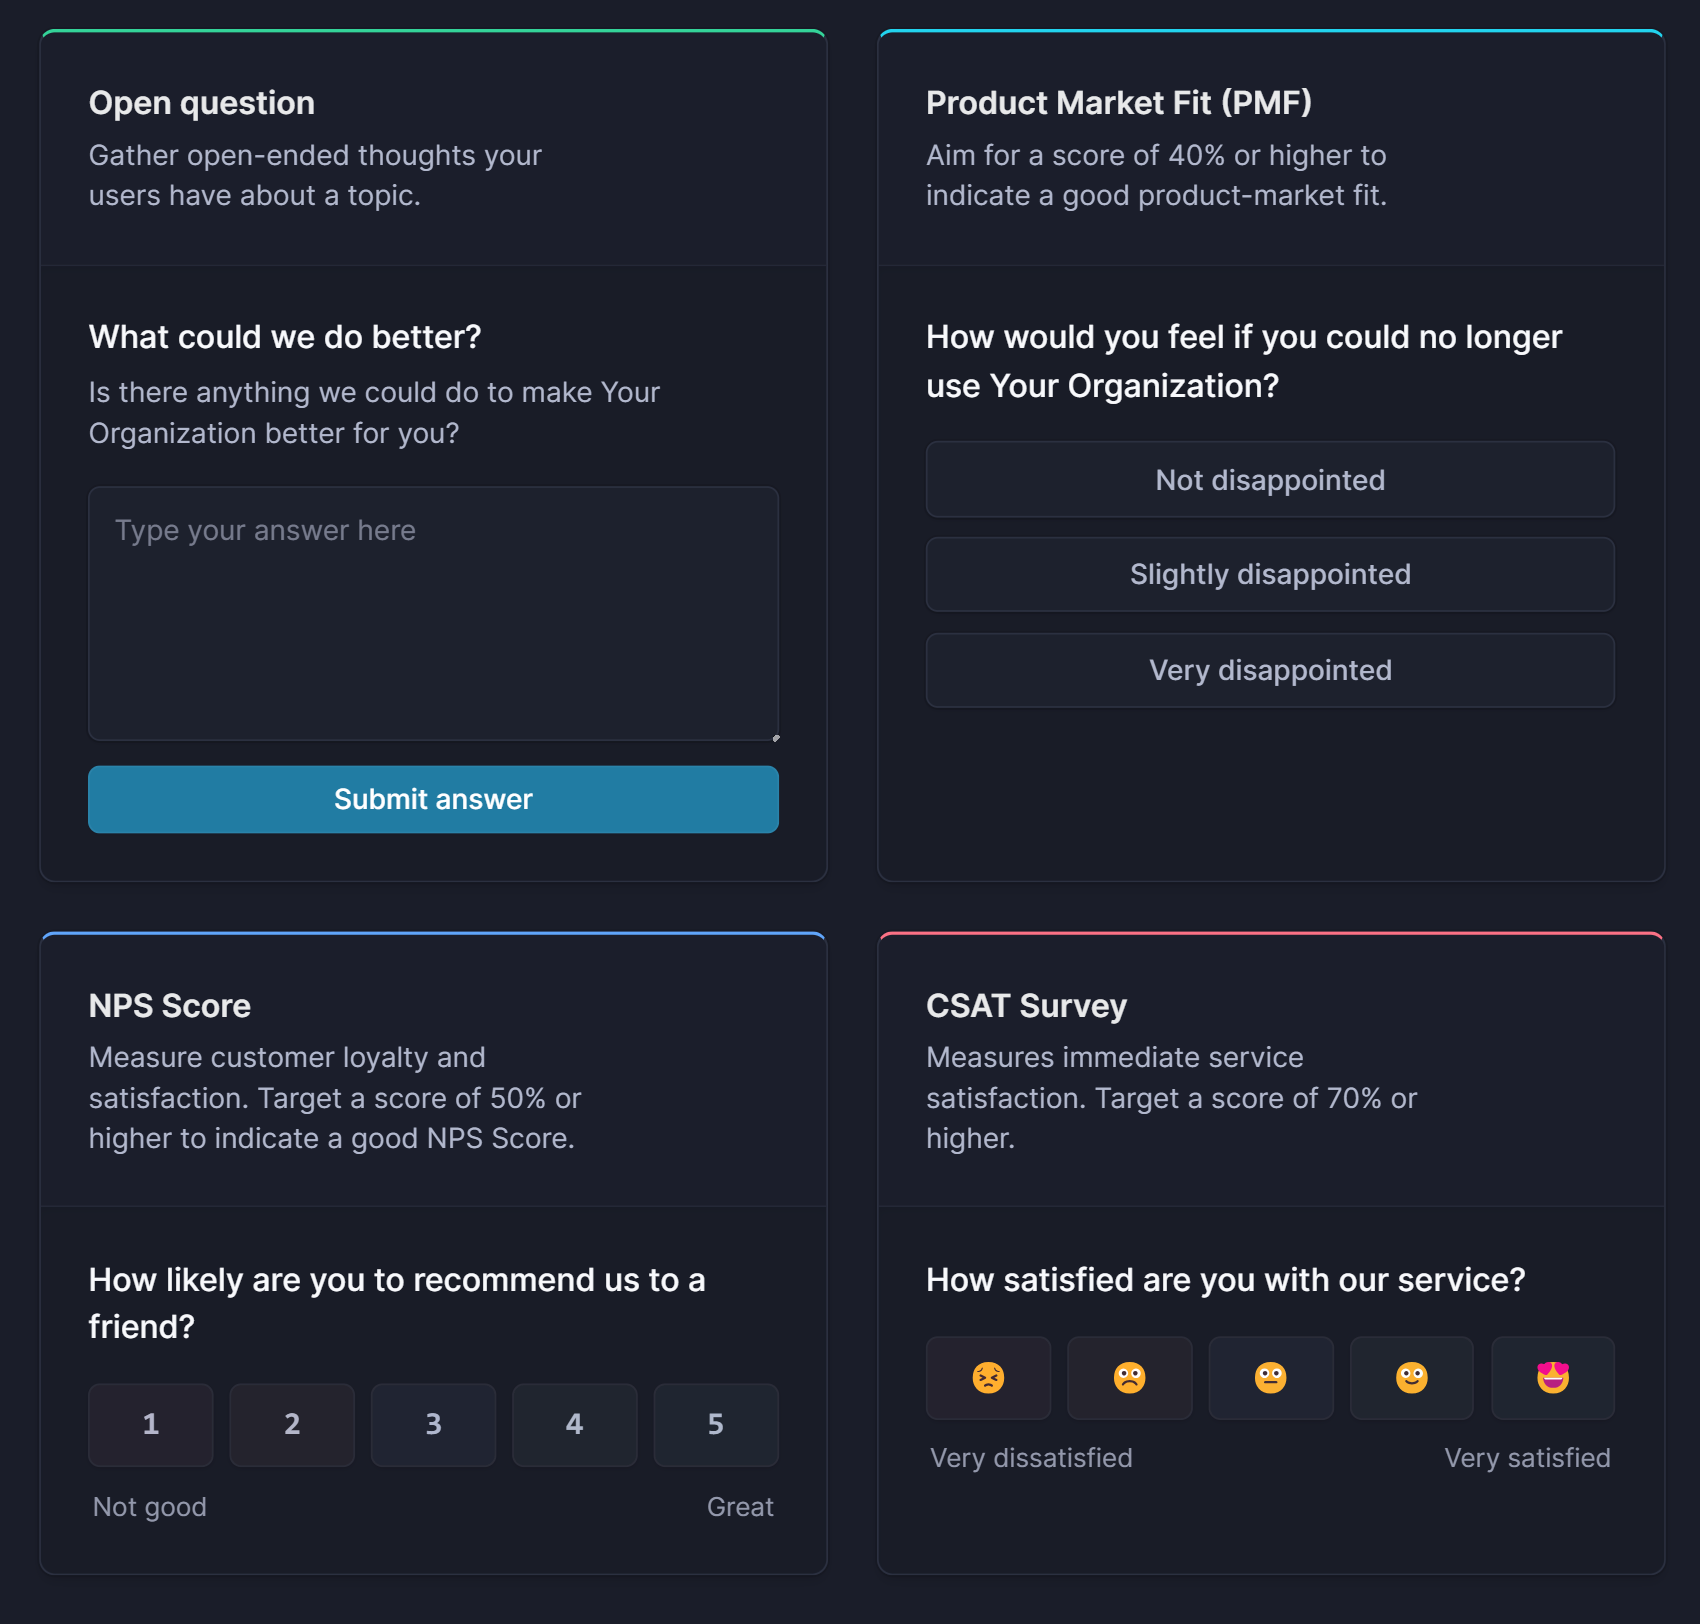
You can collect and prioritize feature requests with Featurebase to see which ones are trending and how many people are asking for them. This will give you an idea of your reach.
And let’s say you eventually estimate your reach to be 5,000 users.
Impact
Before determining impact, you need a clear idea of what “impact” means to you. This will depend on the goal you've set. Impact can mean all kinds of different things to different kinds of products, including:
- Revenue
- Profit
- User satisfaction
- NPS
Data collection sources are key here, and Featurebase can again be a huge help.
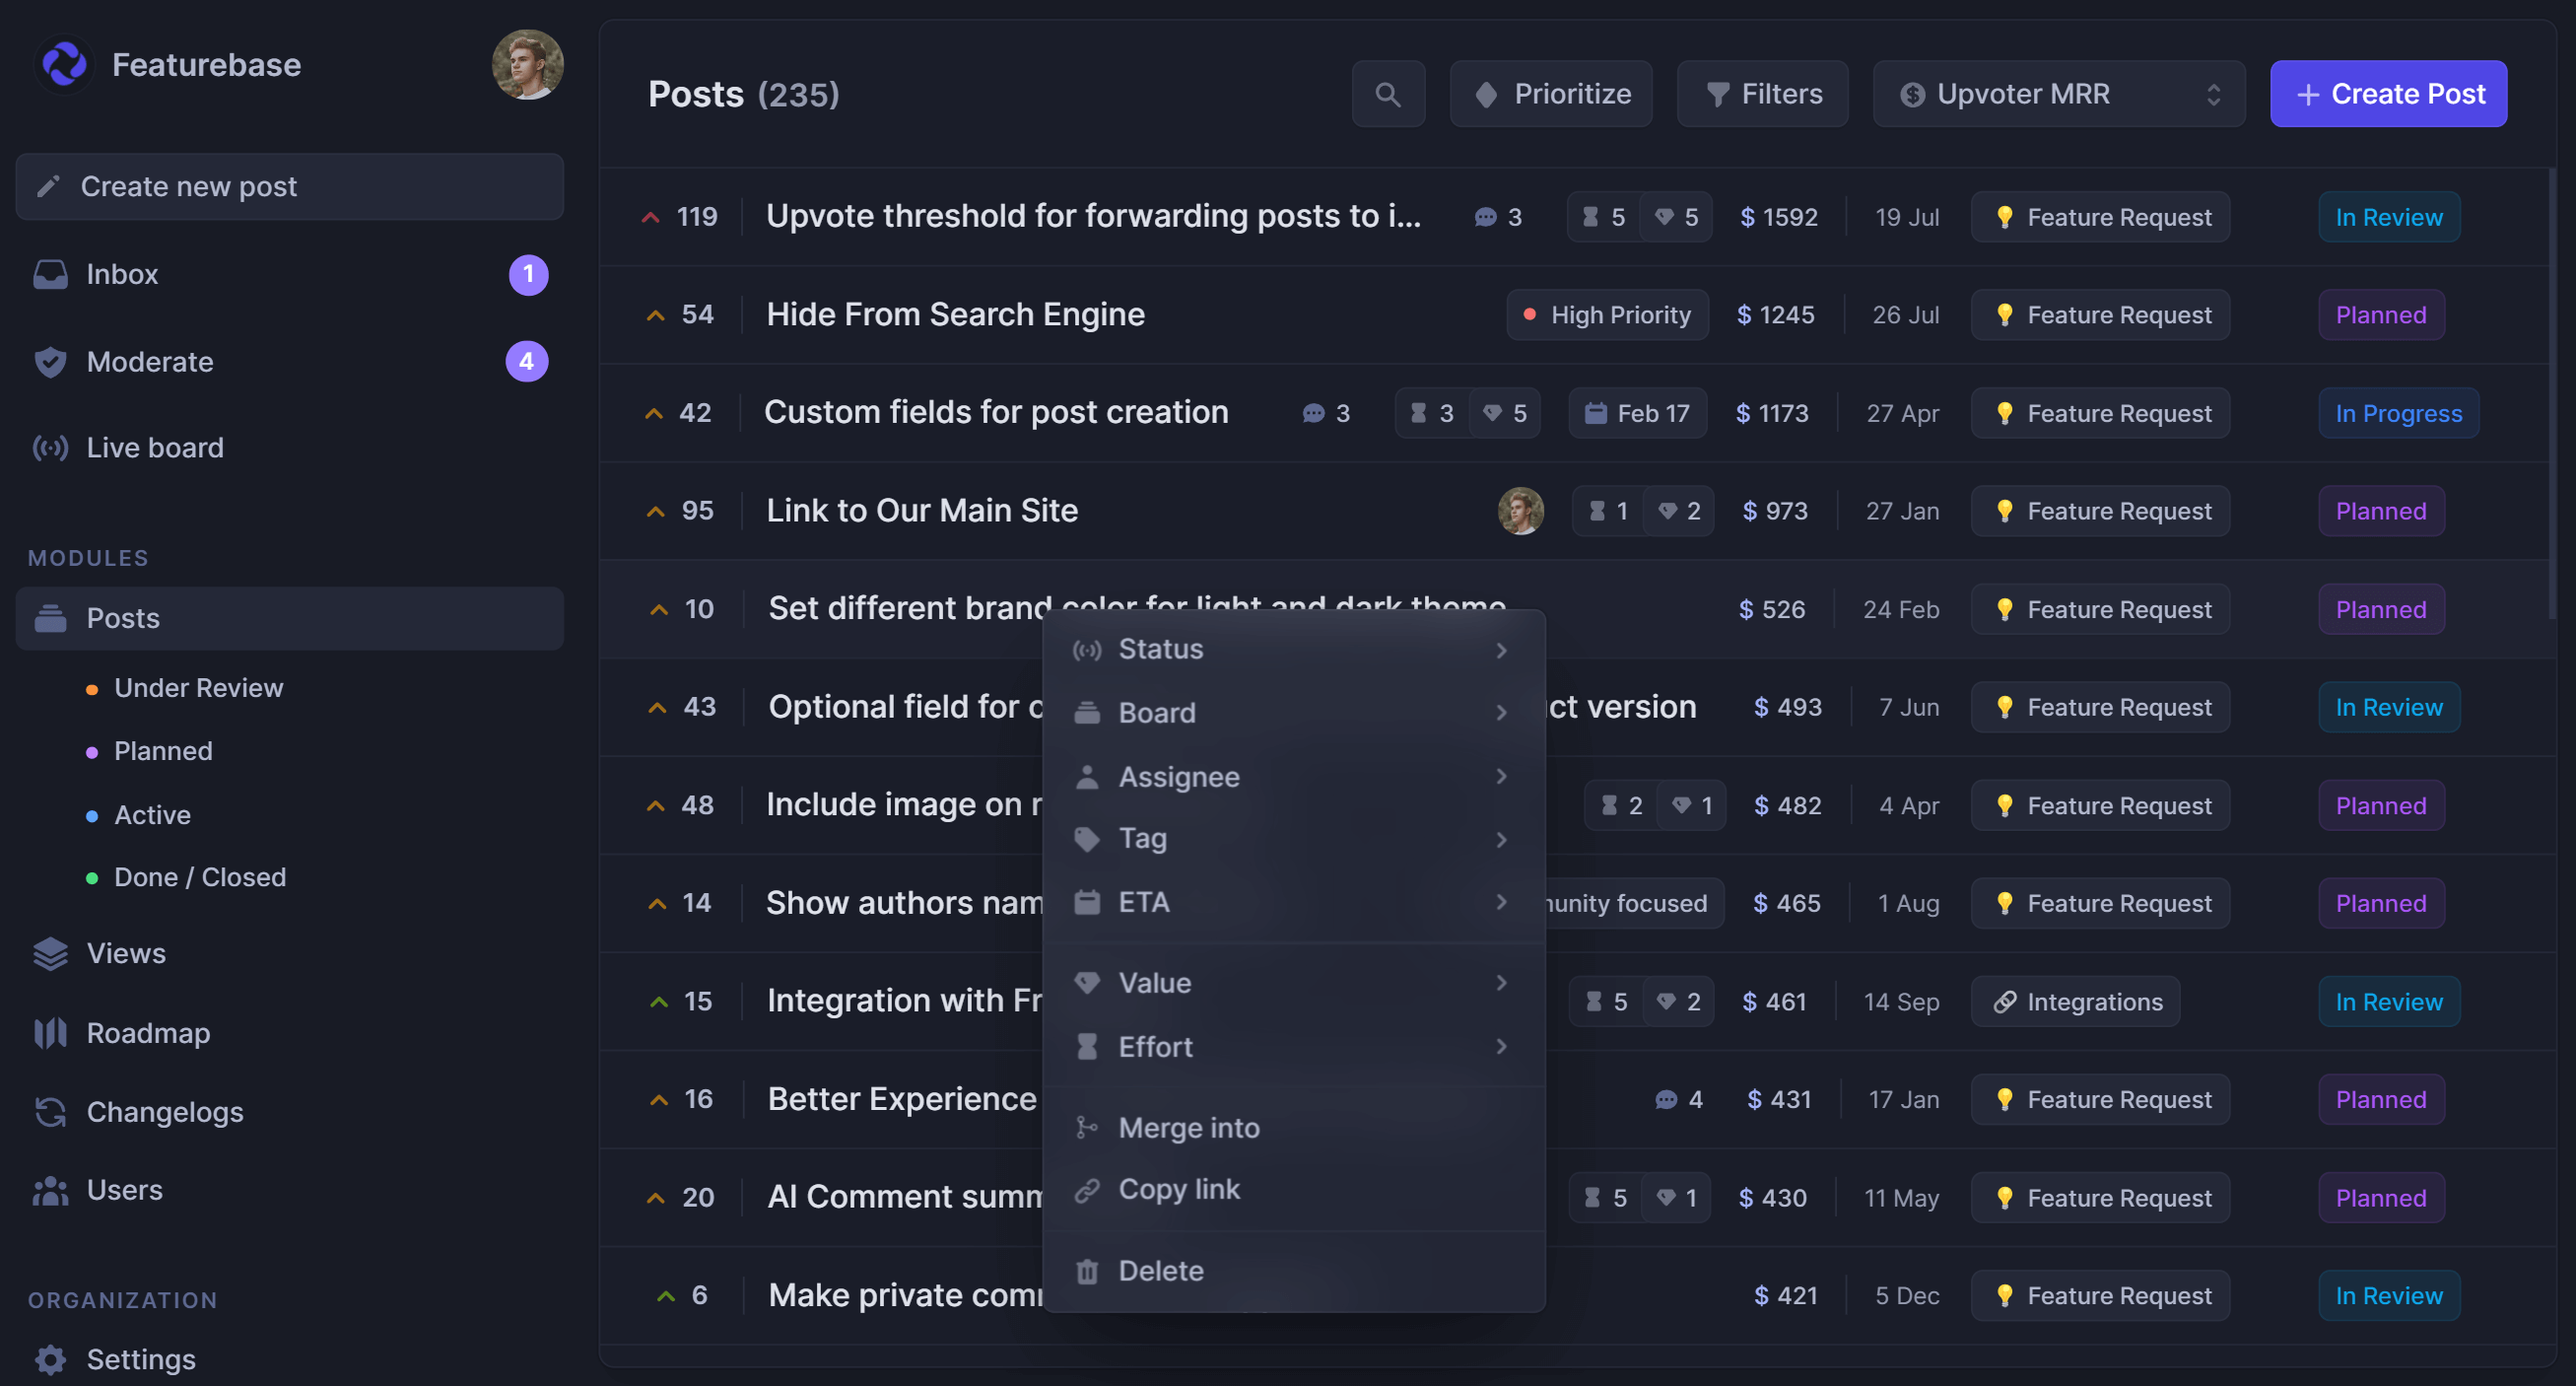
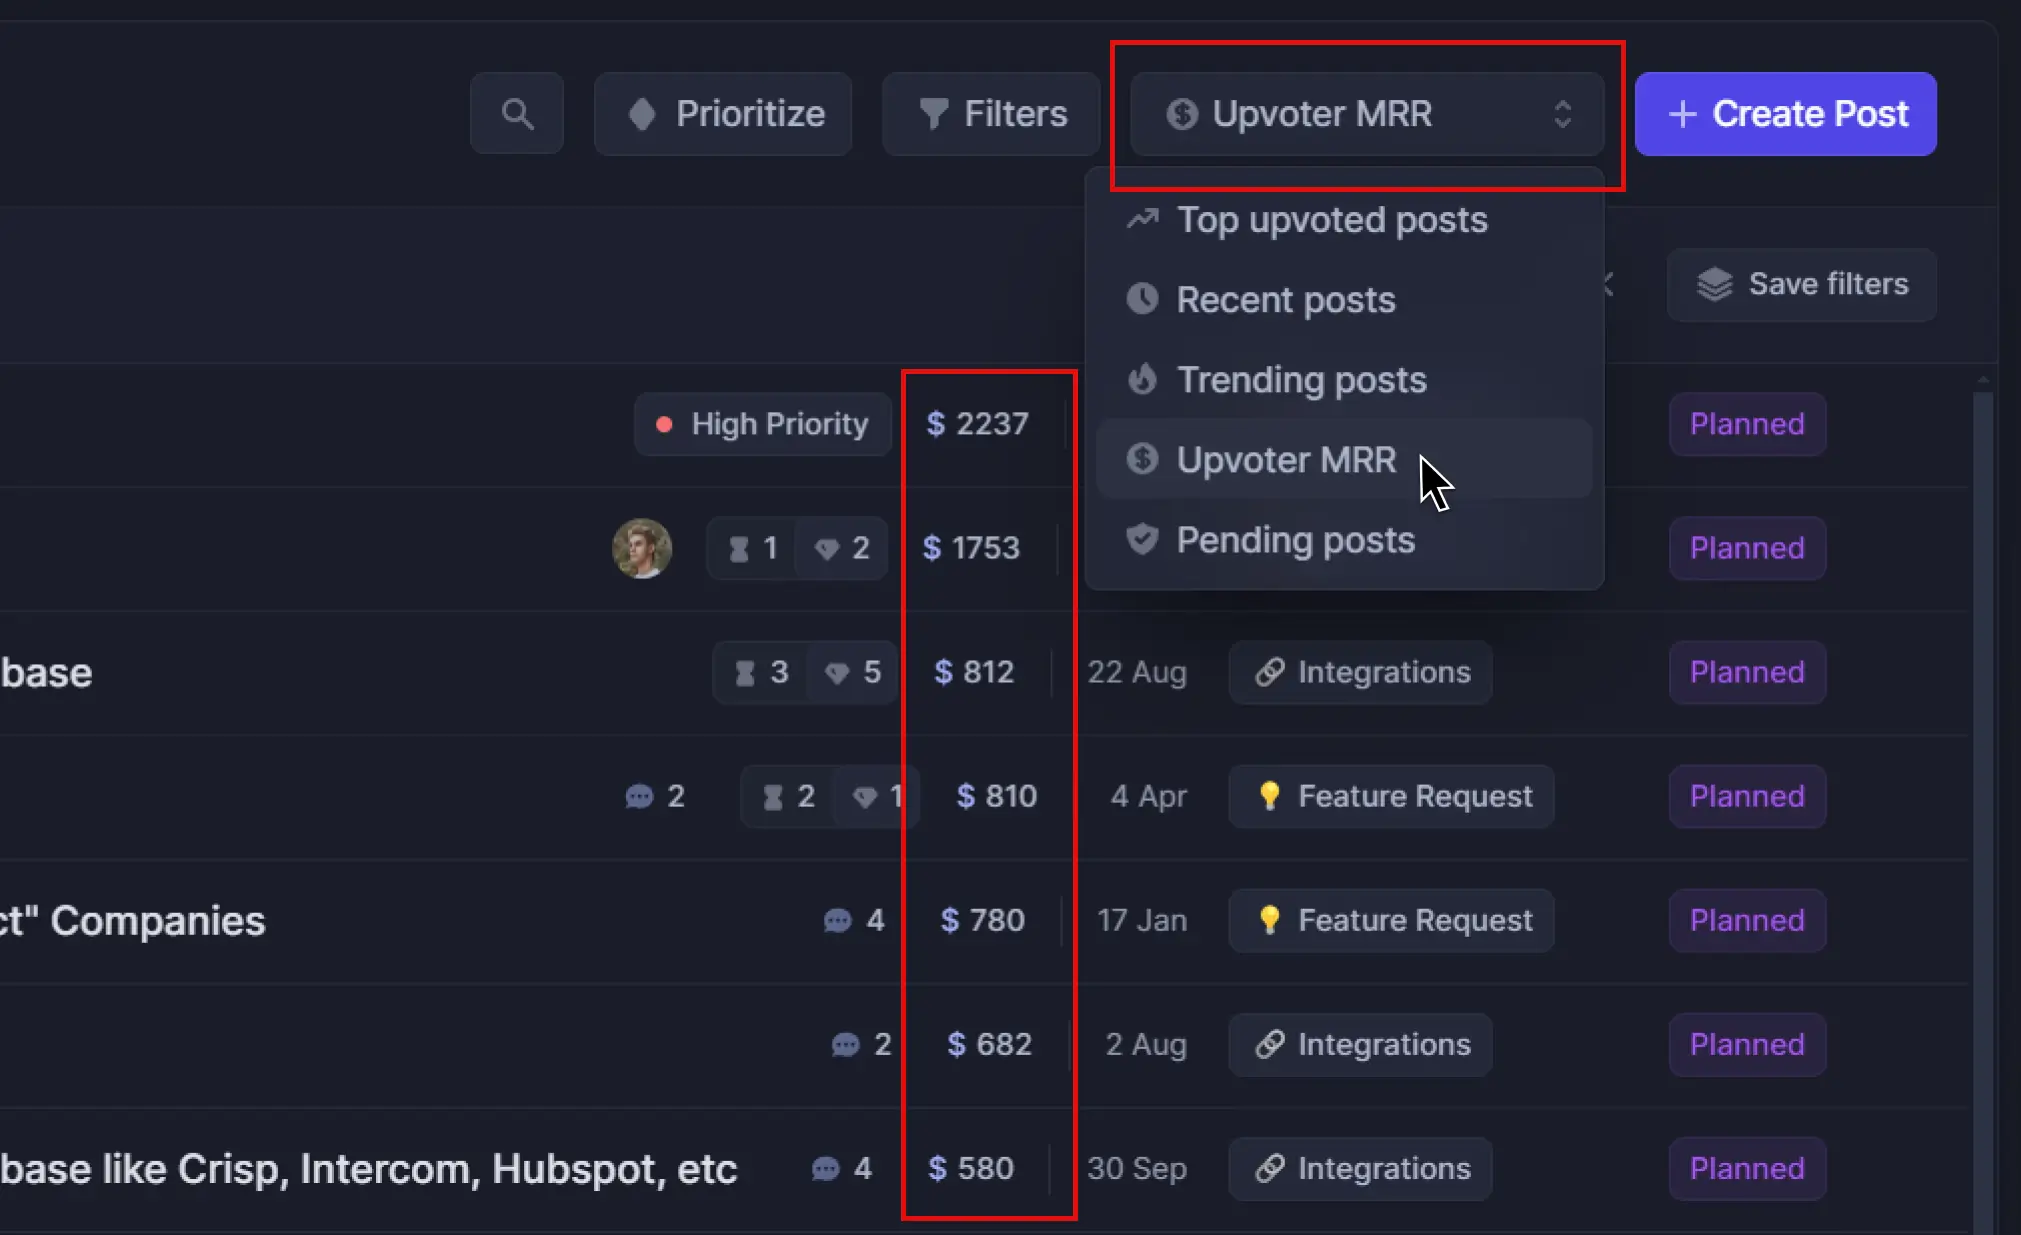
Let’s say your main focus is revenue. With Featurebase, you can connect your users’ data to customer feedback so you can see exactly the revenue behind each feature idea.
Then, you can use actual revenue as a metric to sort and prioritize ideas. 👇
For example, if many small customers have required one feature, but a couple of really big ones have another, it might be worth rating the latter's impact higher, like a 4.
Confidence
Since we’ve been helping you make data-driven decisions so far, you should have a high degree of confidence in your estimates. A confidence rating of 80% isn’t far-fetched—and we’d recommend avoiding features with less than 50%.
Collect more data and come back to the uncertain ones later.
Effort
Estimating effort takes a bit of effort.
You’ll need to sit down with the people who will actually be completing the work, and reach a consensus. This helps minimize the impact of optimism and pessimism. Use techniques like planning poker to help facilitate this process.
For the sake of our example, let’s assume the effort score we arrive at is 4 person-months.
3. Calculate the RICE score
Now that we have all our numbers, it's time to crunch them and calculate the RICE score using this formula:
RICE Score = (Reach × Impact × Confidence) / Effort
Let's plug in our numbers:
- Reach = 5,000
- Impact = 2
- Confidence = 80%
- Effort = 4 (person-months)
So, our RICE formula is:
- (5000 × 2 × 0.8)/4 = 2,000
You'll need to repeat this process for every feature or initiative you consider so that you can compare features.
4. Compare and prioritize
The next step is to rank each initiative based on their RICE scores. You can easily do this using a simple spreadsheet like the one provided here:
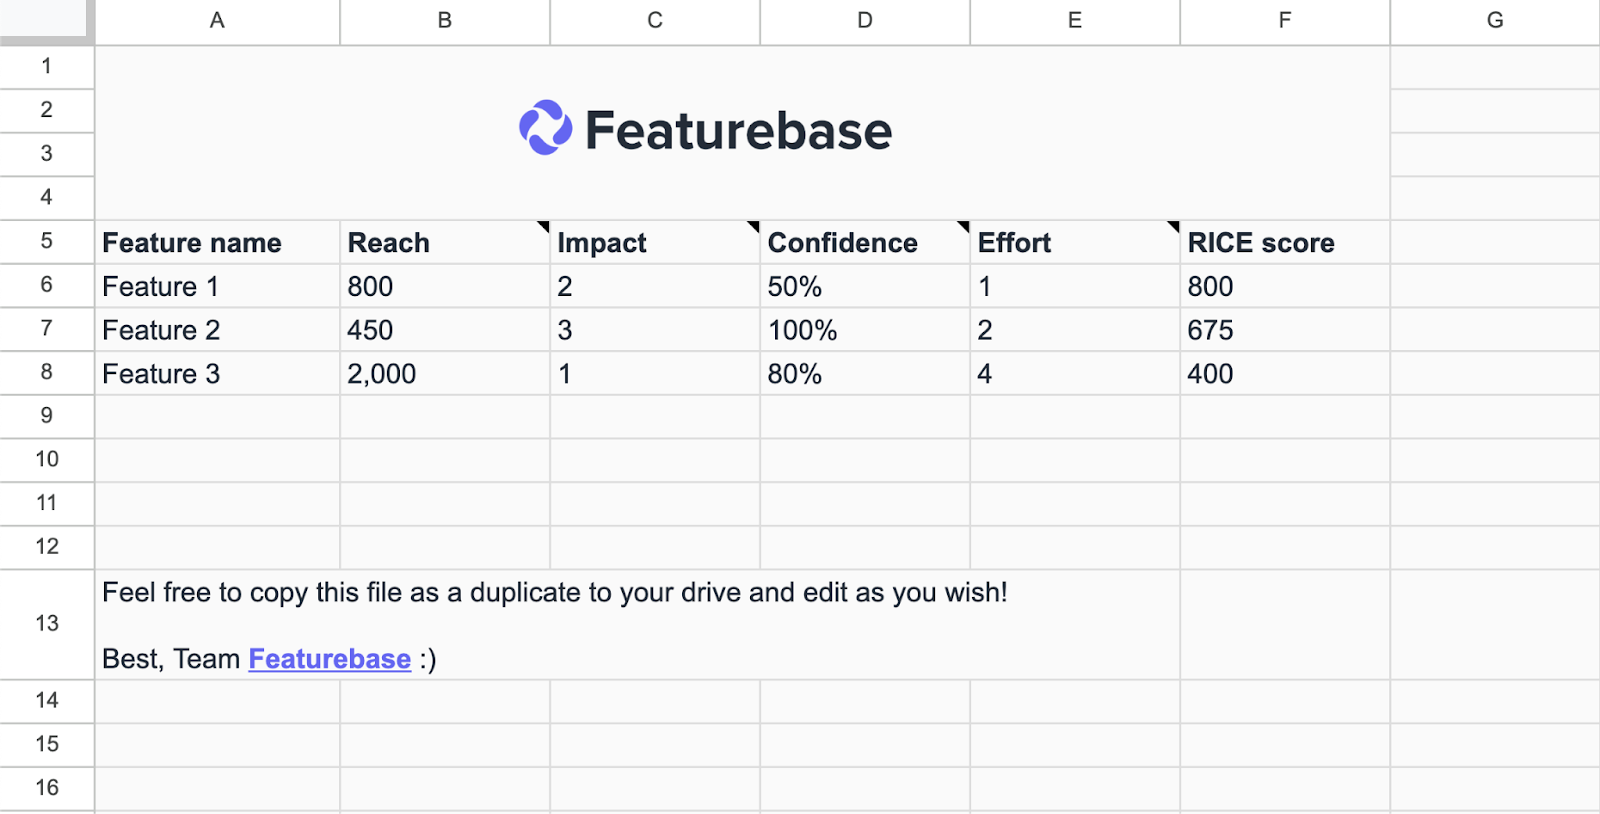
The linked spreadsheet above also automates each calculation for you, so you don’t have to do it manually for all your features.
RICE score template
A RICE score template helps you compare multiple product ideas in one place. Instead of calculating each score manually, you can list every feature, add values for reach, impact, confidence, and effort, and let the template calculate the final score automatically.
This makes it easier to prioritize your backlog, compare initiatives with your team, and avoid making roadmap decisions based only on opinions.
The basic idea is simple: features with high RICE scores usually have broad reach, strong impact, high confidence, and reasonable effort. These are often good candidates for the top of your priority list.
However, don’t prioritize features based on RICE scores alone. Use the scores to start a more informed product discussion. Consider how each feature fits your product strategy, customer needs, and business goals before making the final call.
Sometimes, a lower-scoring feature may still be worth prioritizing if it solves a critical user problem.
5. Execute
Finally, roll up your sleeves and implement the initiatives based on the priorities you’ve hashed out. 👏
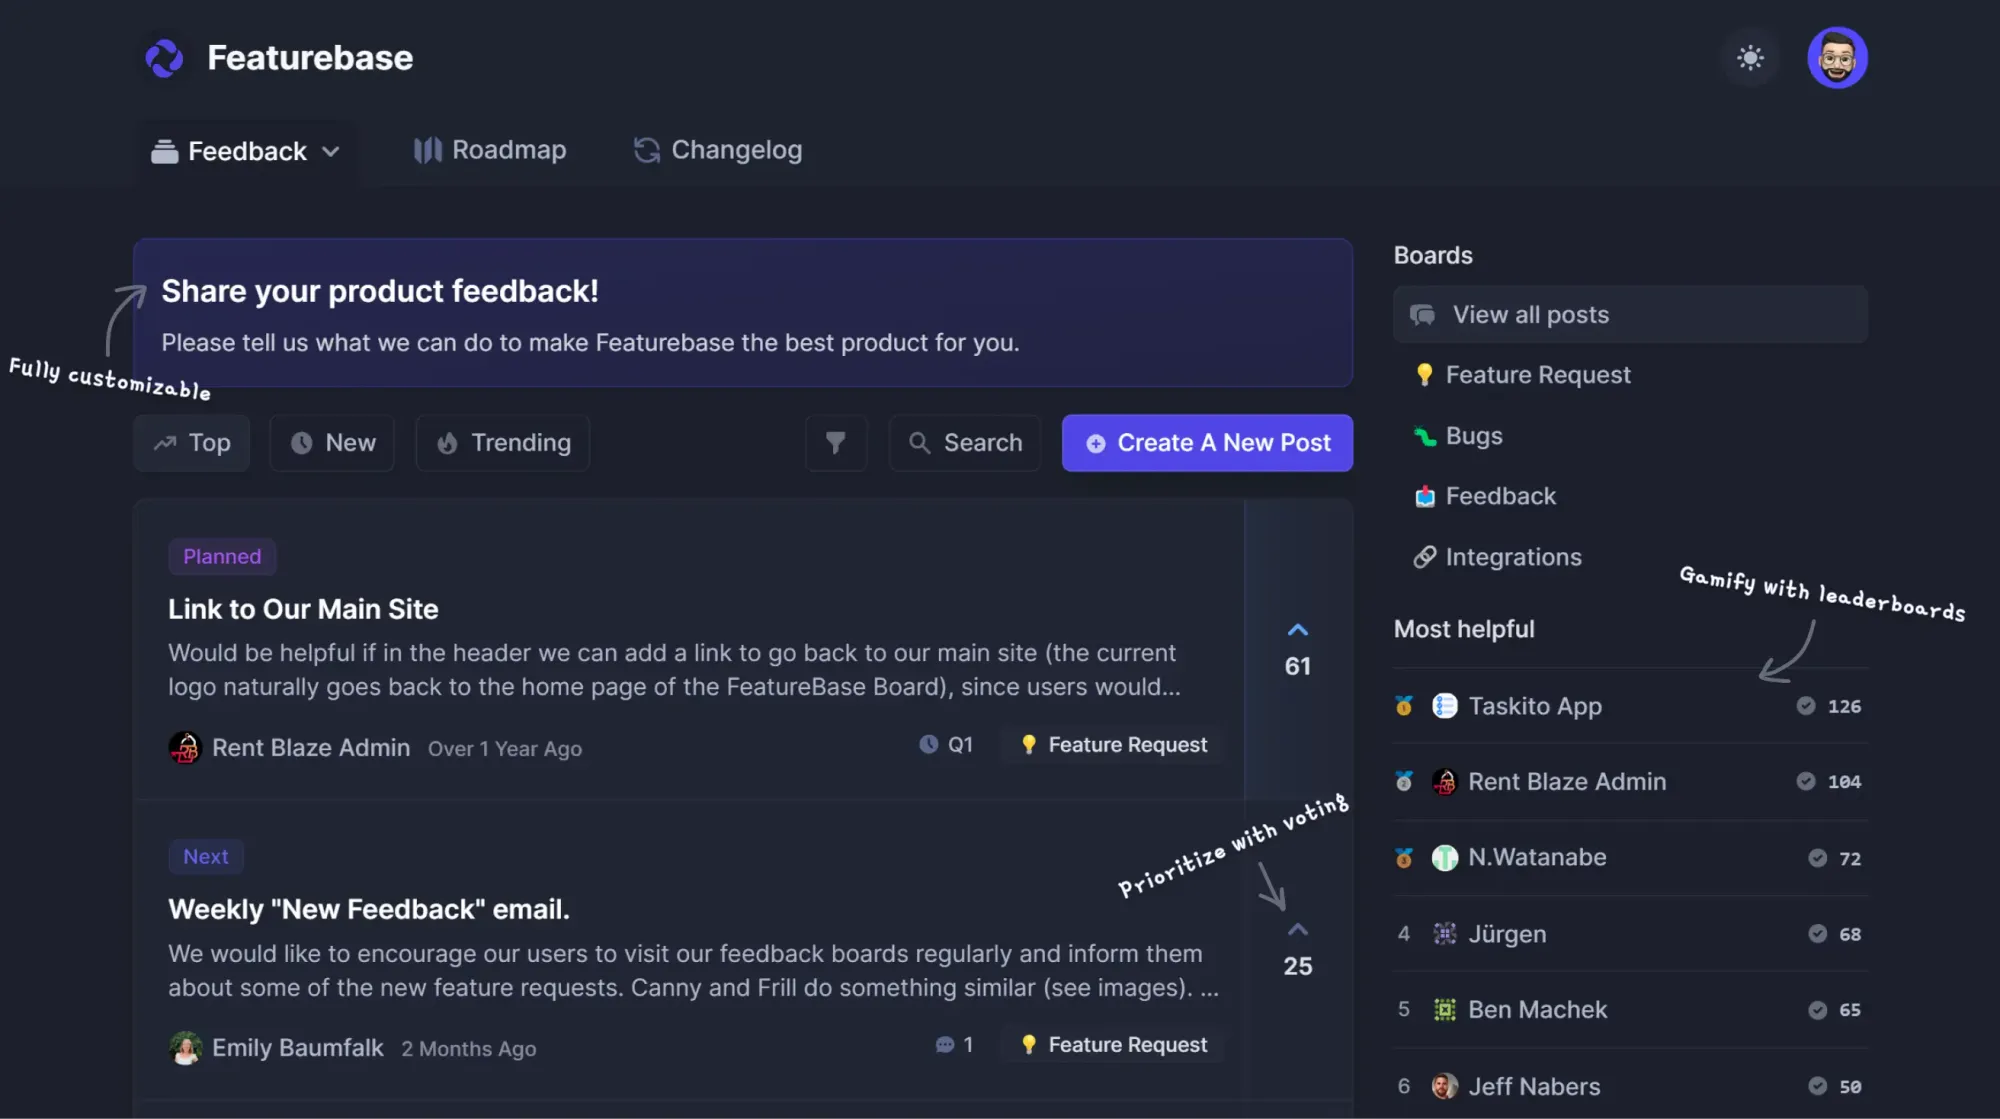
To keep things organized, create a roadmap that visualizes these priorities and closes the feedback loop with users. Featurebase automatically syncs your feature requests and ideas with a roadmap that you can publicly present to your users.
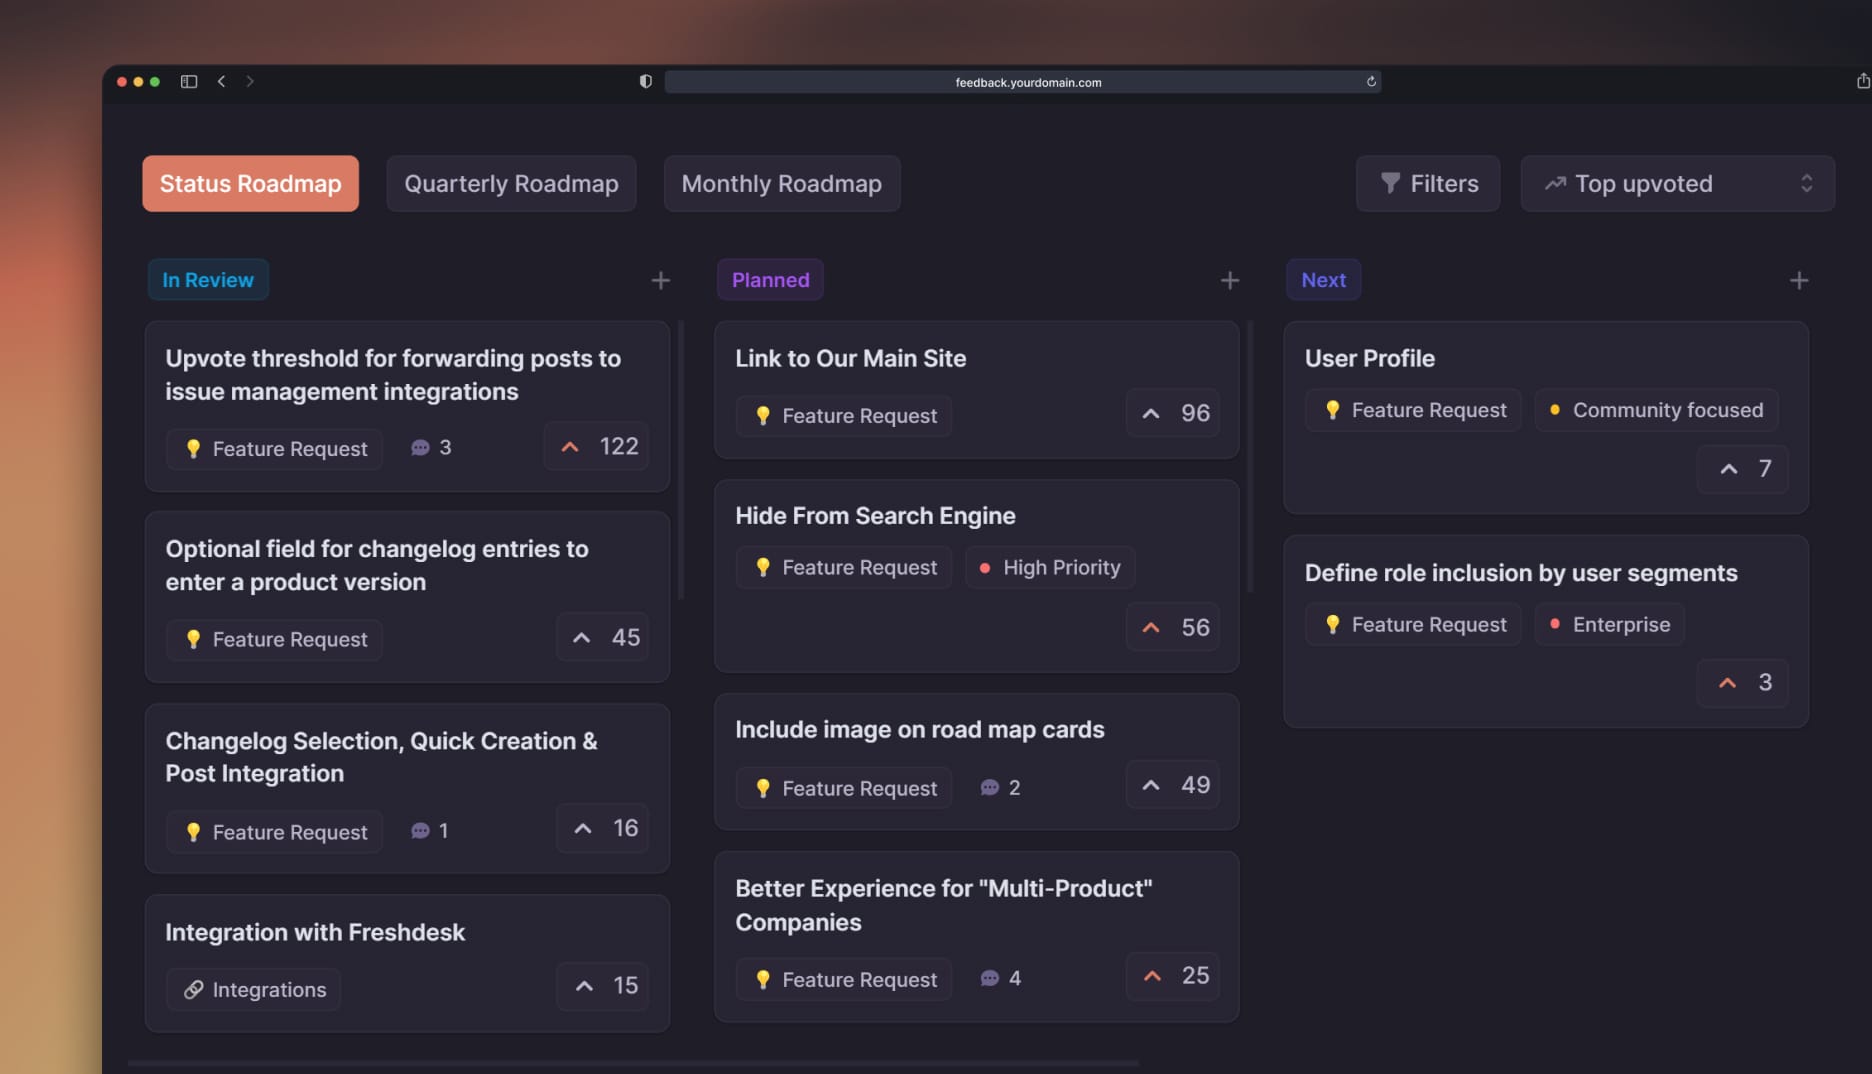
Whenever you update the status of a feature, every upvoted user is automatically emailed a new update. This neat way keeps all relevant users up to date about their requests.

Turn feedback into products your users love
Centralize feedback, identify product opportunities, and build the right features
RICE vs. Value-Effort Matrix
The RICE framework might seem like a new concept, but it’s actually a higher-fidelity version of a well-established prioritization framework—the value-effort matrix. This matrix is a more straightforward cost/benefit prioritization tool that considers two key factors:
- Value: This represents the overall benefit the feature will bring to users and the business (similar to “impact” in the RICE formula).
- Effort: This reflects the resources (time and money) required to develop and implement the feature. It’s presented as a score on a scale rather than a person-month estimate.
Features are plotted on a matrix based on their perceived value and effort. Here’s an example created with Featurebase:
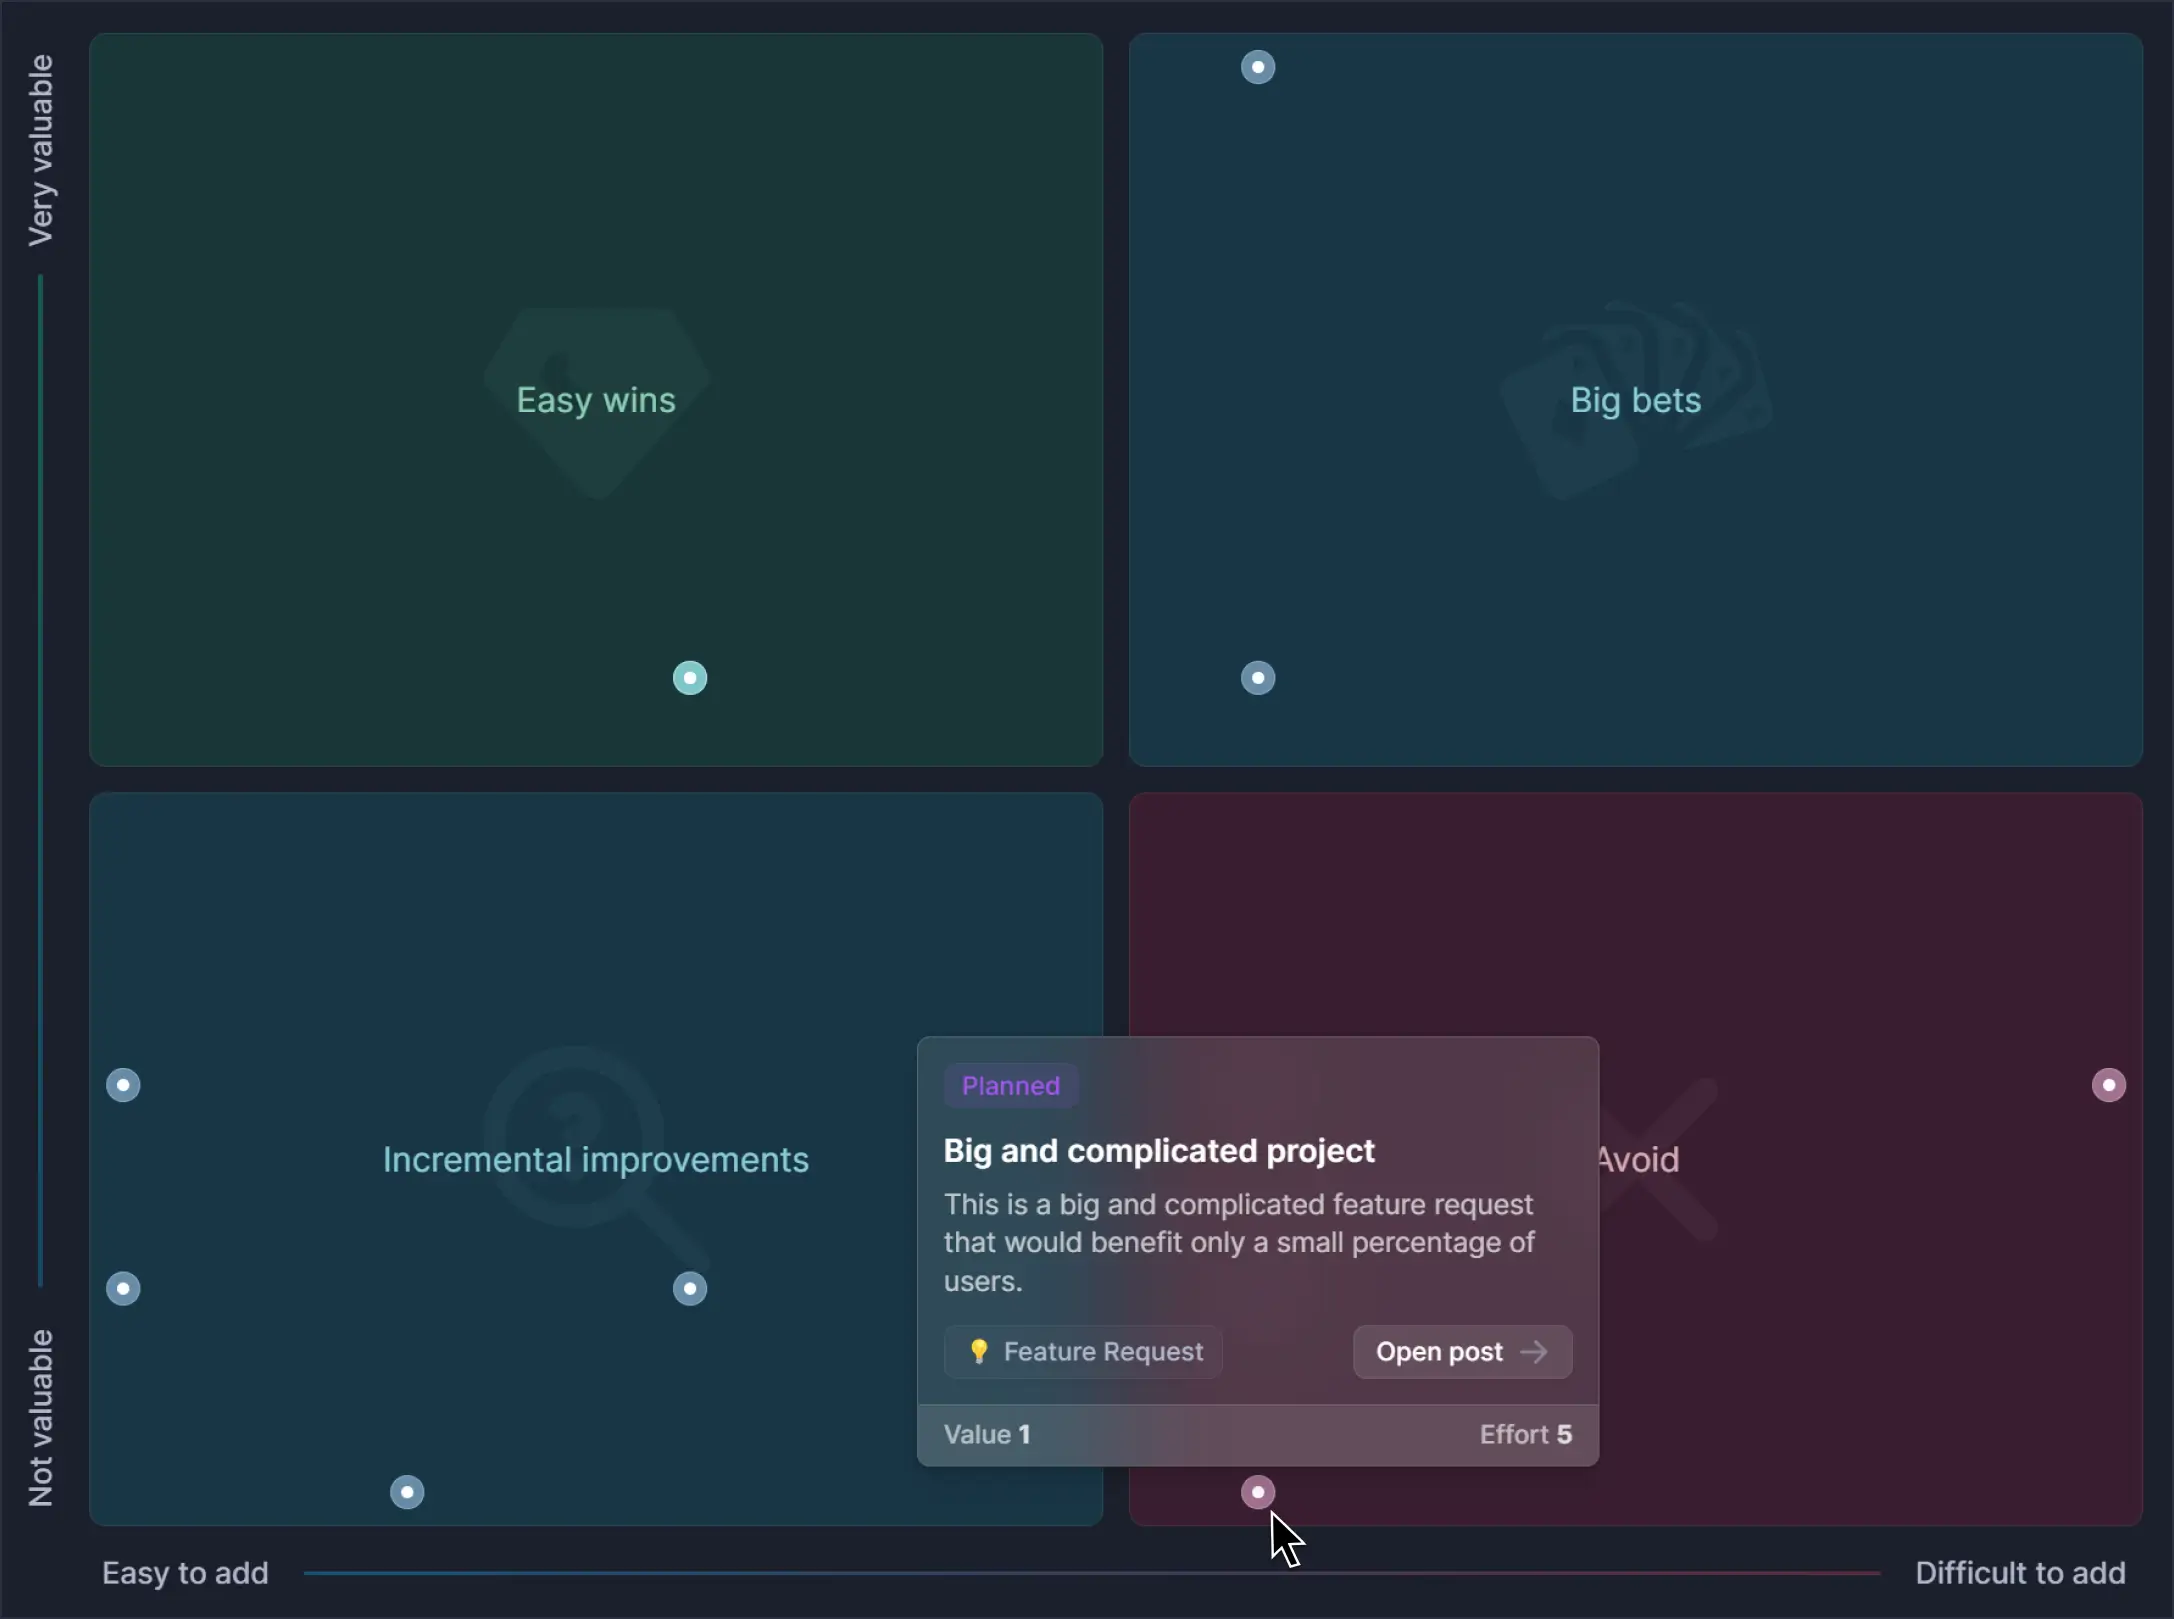
Featurebase makes value-effort analysis a breeze. Simply assign a value and effort score to each feature on your backlog. The result is a straightforward, user-friendly grid like the one shown above, where your priorities are immediately clear:
- Easy wins: Low-effort, high-value features
- Big bets: High-effort, high-value features
- Incremental improvements: Low-effort, low-value features
- Avoid: High-effort, low-value features
So, how exactly is RICE different from the value-effort matrix?
As we mentioned earlier, RICE is a higher-fidelity approach. What we mean by this is that RICE scores (if calculated accurately) are able to give you a more precise understanding of each feature you’re considering.
Why? Because RICE considers four factors while effort-value matrices only consider two. Additionally, RICE incorporates a Confidence score to reflect the fact that not all estimates are equally well-defined.
This isn’t to say the value-effort matrices are bad, though. In fact, their simplicity is actually a good thing in many cases. If you have a smaller team or limited resources, using an effort-value matrix is usually a more practical approach.
Limitations of the RICE framework
- Subjectivity in scoring: Assigning scores for reach, impact, confidence, and effort involves a bit of subjectivity—especially for confidence and effort.
- Data dependence: The accuracy of your RICE scores hinges on the quality of your data. Limited user data or a lack of historical benchmarks can make scoring challenging.
- Focus on quantification: RICE prioritizes features that can be easily quantified. This might overlook qualitative factors like UX improvements or brand perception—both of which are important, but not necessarily for reasons that are reflected in the numbers.
- Could be inaccurate in the future: RICE scores can become dated quickly. You can’t always rely on old RICE scores, and recalculating them can be a hassle.
Overcoming limitations
- Collaborative scoring: Involve stakeholders from different areas (product, development, marketing) to discuss and agree upon scoring criteria for each RICE factor.
- Collect user feedback & data: Actively gather user feedback through surveys, polls, etc. With Featurebase, you can gather accurate data about your potential reach and impact, contributing to a more accurate score overall.
- Qualitative considerations: While RICE emphasizes quantitative data, don't neglect qualitative customer feedback or expert opinions. Use them to complement your scoring and identify potential benefits beyond easy quantification.
- Strategic flexibility: RICE scores are a starting point, not an absolute truth. Integrate your product vision, long-term goals, and market trends into your final prioritization decisions.
Wrapping up
The RICE score is a simple way to prioritize product ideas without relying only on gut feeling. By looking at reach, impact, confidence, and effort, the RICE framework helps you compare initiatives more clearly and decide what deserves a spot on your roadmap.
That said, your RICE scores are only as good as the data behind them. If your reach, impact, or confidence estimates are based on guesses, your priorities can still end up being off.
Featurebase helps you collect and prioritize product feedback with feature voting, surveys, roadmaps, and customer data. You can see what users are asking for, connect feedback to revenue, and make more confident prioritization decisions using real customer insights.
It comes with a Free Plan, and paid plans start at $29/seat/month with $0.29 per AI resolution. The onboarding is quick and doesn’t require a credit card, so there’s no downside to trying it. 👇
✨ Start collecting & prioritizing product feedback with Featurebase for free →
FAQs
What is a RICE score?
A RICE score is a prioritization score used to evaluate product ideas, features, and initiatives. It combines reach, impact, confidence, and effort into one score so teams can compare priorities more objectively.
What does RICE stand for?
RICE stands for Reach, Impact, Confidence, and Effort. These four factors make up the RICE framework and help product teams estimate the value and difficulty of different initiatives.
How do you calculate a RICE score?
You calculate a RICE score using this formula:
RICE Score = (Reach × Impact × Confidence) / Effort
The result gives you a score that can be compared with other features or initiatives.
Is a higher RICE score better?
In general, yes. A higher RICE score usually means an initiative has stronger potential because it reaches more users, creates more impact, has higher confidence, or requires less effort. However, teams should still consider customer context, product strategy, and qualitative feedback before making the final decision.
What is the difference between the RICE framework and the RICE scoring model?
The RICE framework and RICE scoring model usually refer to the same prioritization method. The framework describes the overall approach, while the scoring model refers to the formula used to calculate and compare RICE scores.