Blog Customer FeedbackB2B SaaS Metrics: 15 KPIs, Formulas, and Benchmarks
B2B SaaS Metrics: 15 KPIs, Formulas, and Benchmarks
Track 15 essential B2B SaaS metrics with clear formulas, worked examples, and current benchmarks to understand growth, retention, and acquisition costs.


Your annual recurring revenue (ARR) can rise while customer retention weakens, acquisition costs climb, and cash gets tighter. A growing revenue number can still hide problems across your business.
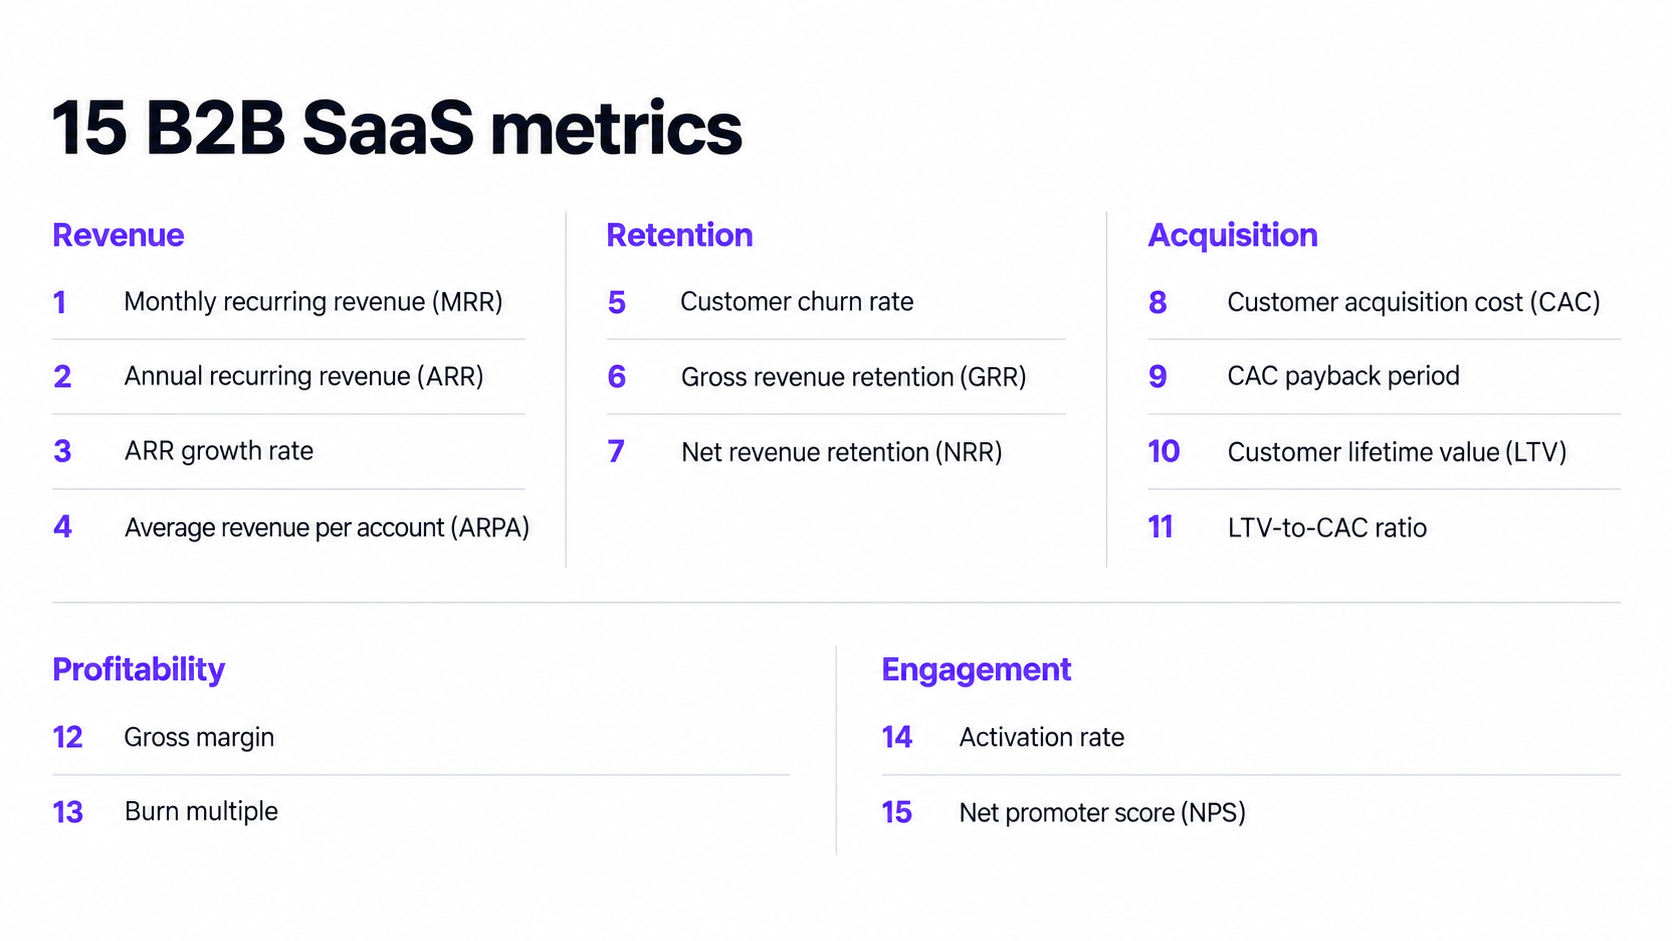
In this guide, I’ll break down 15 B2B SaaS metrics, show you how to calculate them, and explain how to use benchmarks and customer feedback to decide what needs attention first. 👇
Key takeaways
- Growth needs context: Read recurring revenue alongside retention, acquisition costs, and margins to understand how sustainable that growth is.
- Consistent definitions matter: Use the same reporting period and customer groups when calculating or comparing SaaS KPIs.
- Retention needs multiple measures: Customer churn tracks lost accounts, GRR shows revenue kept before expansion, and NRR includes expansion from existing customers.
- Benchmarks need comparable peers: Account for company stage, contract size, and business model before setting targets.
- Featurebase✨ helps you collect customer feedback and connect it with company and revenue data to help prioritize product improvements.
What are B2B SaaS metrics?
B2B SaaS metrics measure how a subscription software business acquires customers, delivers value, retains revenue, and manages costs. A key performance indicator (KPI) is a metric you’ve chosen to track against a specific business goal.
For example, your team might track dozens of actions people take in your product but choose account activation as a KPI for improving onboarding. Finance might focus on recurring revenue and gross margin, while customer success watches retention.
These measures work best together. Revenue shows how much customers pay, while product usage and customer feedback help explain why they stay, upgrade, or leave.
Before calculating anything, agree on a few basics:
- Reporting period: Keep monthly and annual figures clearly labeled, especially for churn and growth.
- Unit of measurement: In B2B SaaS, a customer usually means a paying company or account, which may contain many individual users.
- Customer cohort: Group accounts by a shared starting point, such as signup month or contract start date, when comparing their behavior over time.
- Calculation policy: Document how you handle discounts, usage charges, refunds, and currency changes so trends remain comparable.
The worked examples below are hypothetical and illustrate separate calculations. They aren’t industry benchmarks.
Revenue and growth metrics
These SaaS growth metrics show the size and direction of your recurring revenue. Start here, then check what’s driving the change.
1. Monthly recurring revenue (MRR)
MRR is the monthly value of your recurring subscription revenue. It puts monthly and annual subscriptions on the same basis so you can compare revenue from month to month.
Formula: MRR = Sum of each active subscription’s monthly recurring value
For example, 100 accounts paying $500 per month produce $50,000 MRR. An annual subscription worth $6,000 contributes $500 MRR, even if the customer pays upfront.
Exclude one-time implementation fees and taxes. Use subscription values after recurring discounts, and document whether and how you include variable usage charges.
When MRR changes, separate the causes:
- New business: Recurring revenue from new customers.
- Expansion: Additional recurring revenue from existing customers, such as upgrades or extra seats.
- Contraction: Lost recurring revenue from downgrades or reduced usage.
- Churn: Lost recurring revenue from customers who leave.
An increase driven by new sales can hide losses among existing customers.
2. Annual recurring revenue (ARR)
ARR expresses your current recurring subscription revenue as a yearly amount. Use the same revenue definition as your MRR calculation.
Formula: ARR = MRR × 12
If your MRR is $50,000, your ARR is $600,000.
ARR isn’t the same as cash collected, revenue recognized under accounting rules, or a forecast of what you’ll earn over the next year. Customers can cancel or upgrade after you calculate it.
Use it to track the size of your subscription business and set revenue goals. If usage charges make up a large share of revenue, explain how you convert them into a yearly figure so a temporary spike doesn’t look like a lasting increase.
3. ARR growth rate
ARR growth rate measures how much your recurring revenue base has increased or decreased over a defined period. Year-over-year growth compares the same point in consecutive years.
Formula: ARR growth rate = ((Ending ARR − Starting ARR) ÷ Starting ARR) × 100
Growing from $480,000 ARR to $600,000 ARR over a year gives you 25% annual ARR growth.
Use the same calculation rules and reporting intervals each time. A monthly growth rate and a yearly growth rate tell different stories, even when the percentages look similar.
Then inspect the sources of growth. New customers, account expansion, and price increases can all lift ARR, but they call for different decisions about hiring and product investment.
4. Average revenue per account (ARPA)
ARPA shows how much recurring revenue the average paying account generates. This is useful when several people use your product under the same company account.
Formula: Monthly ARPA = MRR ÷ Number of paying accounts
With $50,000 MRR and 100 paying accounts, monthly ARPA is $500.
Keep free accounts out of this paid-account calculation. If you use an average account count across the month instead of a month-end count, document that choice and apply it consistently.
Segment ARPA by plan or customer type before changing pricing. Your overall average can rise because smaller customers churned, even when no remaining customer increased their spending.
Customer retention metrics
SaaS retention metrics reveal whether customers stay and how their spending changes. Read these 3 together so account expansion doesn’t hide underlying losses.
5. Customer churn rate
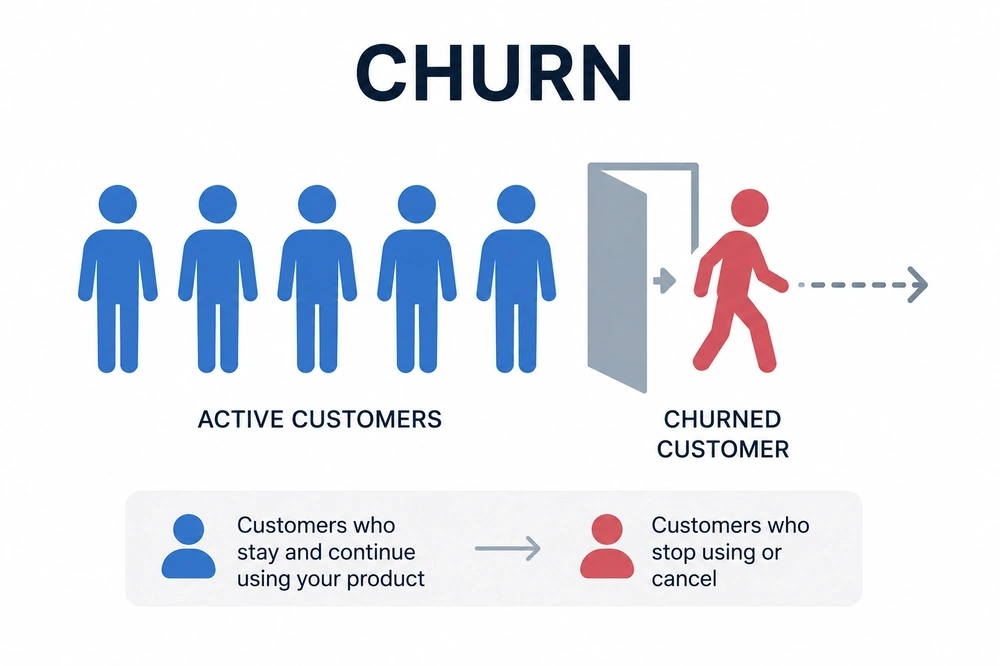
Customer churn rate is the percentage of customers you lose from the group you had at the beginning of a period. It’s also called logo churn, where each company counts as 1 customer regardless of its contract size.
Formula: Customer churn rate = (Customers lost from the starting group ÷ Customers at the start) × 100
If you start a month with 100 customers and 4 of those customers leave, monthly customer churn is 4%. Keep customers who joined during the month out of this calculation.
Count losses consistently, such as when a cancellation becomes effective. Don’t switch between cancellation requests and expired contracts across reporting periods.
To investigate a spike, compare churn by onboarding cohort, plan, and customer use case. Follow up on cancellation feedback to understand whether customers struggled with the product, lacked a needed capability, or stopped needing the service.
6. Gross revenue retention (GRR)
GRR measures how much recurring revenue you retain from existing customers before counting expansion. It exposes revenue lost through cancellations and downgrades.
Formula: GRR = ((Starting recurring revenue − Churned revenue − Contraction revenue) ÷ Starting recurring revenue) × 100
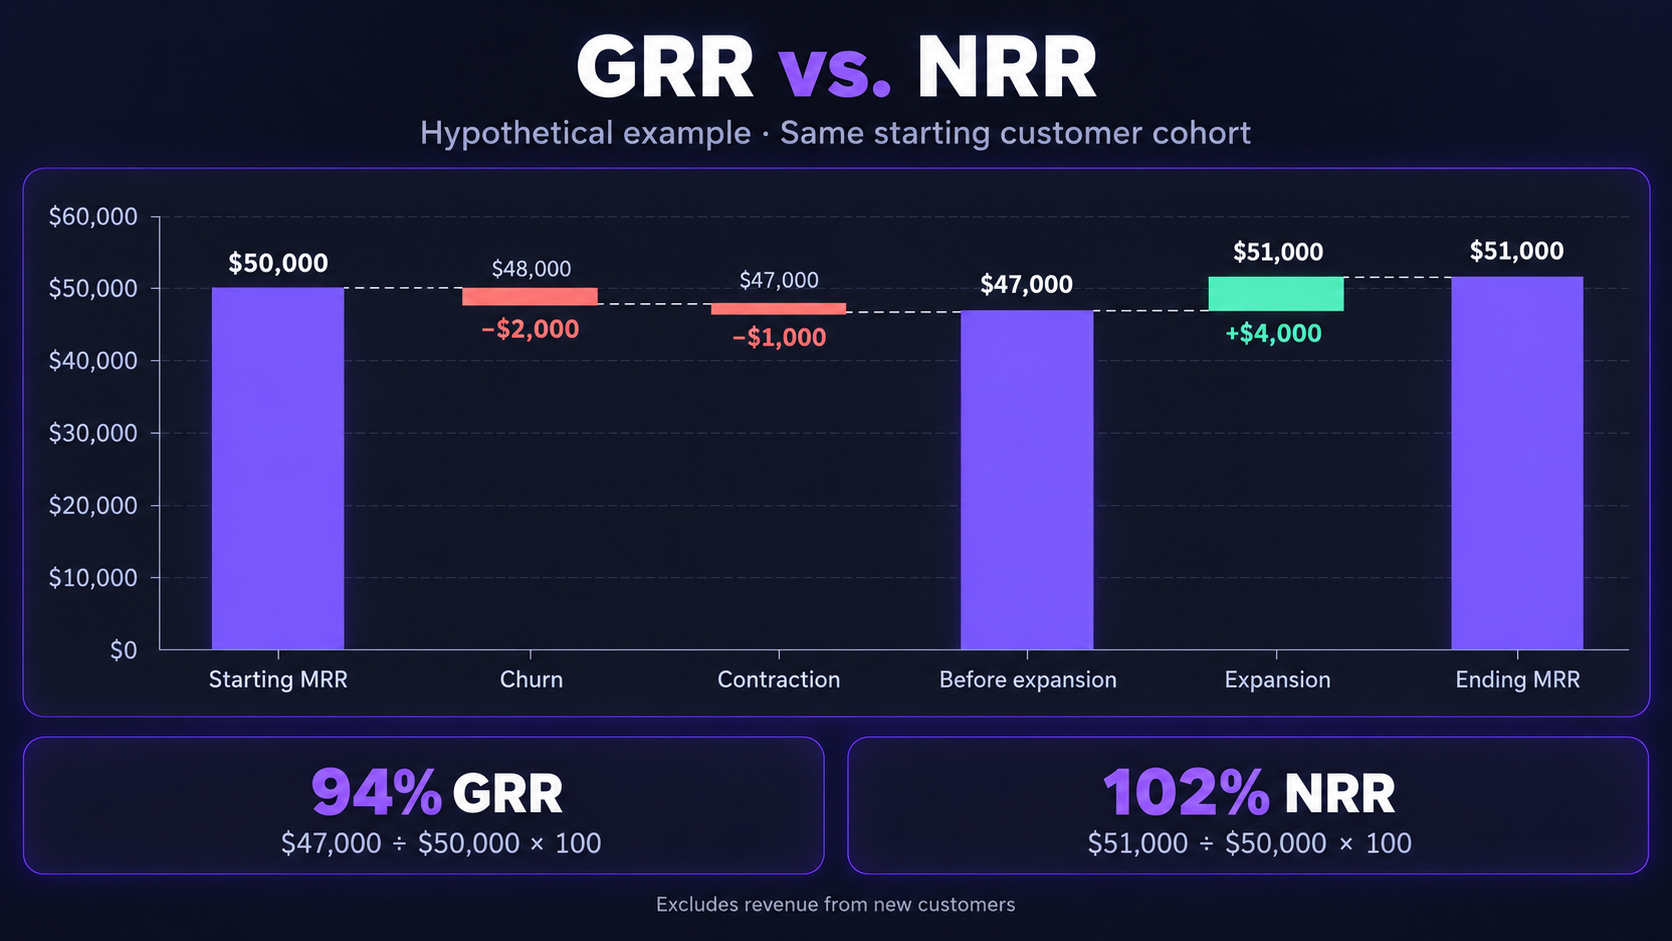
Suppose your existing customers generate $50,000 MRR at the start of the month. Cancellations then remove $2,000 and downgrades remove $1,000, giving you 94% monthly GRR.
GRR can’t exceed 100% because it excludes expansion and new customers. Use the same starting cohort for every part of the calculation.
If GRR falls while total revenue grows, look into the losses before assuming acquisition is solving the problem. Repeated downgrades may point to weak feature adoption or a mismatch between pricing and delivered value.
7. Net revenue retention (NRR)
Net revenue retention measures revenue retained from an existing customer cohort after accounting for both losses and expansion. It shows whether that group’s spending is growing or shrinking.
Formula: NRR = ((Starting recurring revenue + Expansion revenue − Churned revenue − Contraction revenue) ÷ Starting recurring revenue) × 100
Using the same $50,000 starting MRR, add $4,000 in expansion and subtract $2,000 in churn and $1,000 in contraction. That gives you 102% monthly NRR.
Exclude revenue from new customers. NRR above 100% means expansion outweighed losses within the measured cohort, not that every customer stayed.
Always pair it with GRR and logo churn. A few large upgrades can lift NRR while a broader group of accounts struggles, so inspect which customers expanded and which left.
Customer acquisition and unit economics
These metrics connect the cost of winning customers with the gross profit they may generate. Calculate them separately for customers who sign up on their own and those who need help from your sales team.
8. Customer acquisition cost (CAC)
CAC is the average cost of acquiring a new paying customer. It should include the acquisition costs needed to win the business, not just advertising spend.
Formula: CAC = Acquisition-related sales and marketing costs ÷ New paying customers acquired
If you spend $40,000 to acquire 10 new customers, CAC is $4,000.
Include relevant salaries, commissions, campaigns, and tools. Separate the cost of winning new customers from the cost of retaining or upselling existing ones, and explain how you divide any shared costs.
For long sales cycles, this month’s closed deals may come from spending several months earlier. Match spending to the customers it helped acquire, or use a longer reporting period so the timing of a few deals doesn’t distort CAC.
9. CAC payback period
CAC payback period estimates how many months of customer gross profit it takes to recover acquisition costs. Using gross profit accounts for the cost of serving the customer.
Formula: CAC payback period = CAC ÷ (Monthly ARPA × Gross margin as a decimal)
With $4,000 CAC, $500 monthly ARPA, and 80% gross margin, the calculation is $4,000 ÷ ($500 × 0.80). Your estimated payback period is 10 months.
This simplified model assumes stable revenue and margin. The actual time to recover acquisition costs can change with churn, expansion, discounts, and service costs.
If payback lengthens, investigate both acquisition spending and the gross profit each account produces. A lower-priced plan may be easy to sell but take longer to cover the cost of a hands-on sales process.
10. Customer lifetime value (LTV)
LTV estimates the gross profit a customer generates over their relationship with your business. This gross-profit version makes it easier to compare customer value with acquisition costs.
Formula: Estimated LTV = (Monthly ARPA × Gross margin as a decimal) ÷ Monthly customer churn rate as a decimal
At $500 monthly ARPA, 80% gross margin, and 2.5% monthly customer churn, estimated LTV is $16,000.
This shortcut assumes customers have similar spending patterns and churn stays steady. It ignores expansion and becomes unreliable when churn is very low or you have little customer history.
Don’t substitute net revenue churn into this formula, especially when expansion makes it negative. Once you have enough history, look at the gross profit and retention of customers who joined around the same time to build a more realistic estimate.
11. LTV-to-CAC ratio
The LTV-to-CAC ratio compares estimated lifetime gross profit with the cost of acquiring a customer. It helps you assess the economics of an acquisition strategy.
Formula: LTV-to-CAC ratio = LTV ÷ CAC
With $16,000 estimated LTV and $4,000 CAC, your ratio is 4:1.
That means an estimated $4 in lifetime gross profit for each $1 spent acquiring the customer, before other operating costs. It doesn’t mean you’ve already earned that money.
Check CAC payback and how long your remaining cash will last (your cash runway) before increasing spend. A high ratio based on optimistic retention assumptions can still leave you waiting years to recover your investment. Leaving out shared costs can also make a marketing channel look more profitable than it is.
Profitability and efficiency metrics
These SaaS financial metrics help you understand the cost of serving customers and funding growth. They add context that revenue growth alone can’t provide.
12. Gross margin
Gross margin is the percentage of revenue remaining after the direct cost of delivering your service. It shows how much is left to fund other operating expenses.
Formula: Gross margin = ((Revenue − Cost of goods sold) ÷ Revenue) × 100
If monthly revenue is $100,000 and cost of goods sold is $20,000, gross margin is 80%.
Delivery costs can include hosting, customer support, third-party infrastructure, and the cost of running AI features. Agree with finance on which costs belong in this category and include them consistently.
Gross margin isn’t net profit. Sales, marketing, research, and administrative expenses still need funding, so review whether high-usage customers or service-heavy plans generate enough gross profit to support the business.
13. Burn multiple
Burn multiple measures how much net cash you burn for each dollar of net new ARR. It connects cash consumption with growth in the recurring revenue base.
Formula: Burn multiple = Net cash burn during the period ÷ Net new ARR during the period
If you burn $150,000 in a quarter and add $100,000 in net new ARR over that quarter, your burn multiple is 1.5×.
Exclude new loans and investment when calculating net cash burn. For net new ARR, subtract starting ARR from ending ARR so the figure includes downgrades and cancellations.
A lower positive multiple means you used less cash for each dollar of ARR added. If ARR is flat or falling, the ratio is no longer a useful measure of cash spent on growth. If the business generates cash, report that directly instead of treating a negative burn multiple as an efficiency target.
Product engagement and customer sentiment
Financial metrics show business outcomes. These customer signals help you understand whether people are getting value from your product and how they feel about the experience.
14. Activation rate
Activation rate measures the percentage of new accounts that complete a key action within a set time. That action should show that customers have started getting value from your product.
Formula: Account activation rate = (New accounts completing the key action within the time limit ÷ Total new accounts in the group being measured) × 100
For a project management tool, you might count an account as activated when a team creates a project and completes its first task. If 60 of 100 new accounts do this within 7 days, their 7-day activation rate is 60%.
Choose an action tied to the main problem your product solves, then check whether accounts that complete it are more likely to stay. Measure the whole account when getting value depends on several teammates working together.
Give every account the same amount of time before comparing results. If activation drops, inspect your customer onboarding and ask affected users where they got stuck.
15. Net promoter score (NPS)
Net promoter score measures customers’ stated likelihood of recommending your product. It uses a 0–10 rating scale with 3 response groups, following Bain’s NPS methodology:
- Promoters - scores of 9–10
- Passives - scores of 7–8
- Detractors - scores of 0–6
Formula: NPS = Percentage of promoters − Percentage of detractors
If 100 people respond, with 60 promoters, 25 passives, and 15 detractors, your NPS is 45. Include passives in the total response count used to calculate both percentages.
Report NPS as a score, not a percentage. Survey similar customer groups at comparable times, and read the written responses before deciding what to fix.

Featurebase lets you run targeted NPS surveys and collect follow-up feedback from specific customer groups. The responses help explain the score, while renewal and usage data show whether those customers’ behavior changes.
How to benchmark your B2B SaaS metrics
Useful SaaS metrics benchmarks compare businesses with similar economics. A company selling annual contracts through a sales team won’t have the same acquisition costs or payback patterns as a self-serve product.
For current context, SaaS Capital’s 2026 research reports median 2025 growth of 22% across its survey of more than 1,000 private B2B SaaS companies. The reported medians were 20% for bootstrapped companies and 25% for equity-backed companies.
These medians describe the companies surveyed. Use them as a reference, then narrow the comparison to businesses with a similar size, customer base, and funding model.
Before comparing your numbers, check these dimensions:
| Dimension | What to match |
|---|---|
| Company stage | ARR, maturity, and funding model |
| Customer base | Contract value, target market, and how customers buy |
| Reporting period | Monthly, quarterly, or annual measurement |
| Metric definition | What counts as revenue, which costs are included, and which customers are counted |
| Data quality | Sample size, collection date, and whether the result is a median or average |
For retention, don’t compare monthly NRR with an annual benchmark. For payback, check whether the benchmark adjusts for gross margin before deciding you’re ahead of it.
I’d use external benchmarks to spot areas to investigate, then set targets based on your own customer data and available cash. Tracking whether a specific customer group is improving gives you more direction than comparing your overall results with a broad industry average.

Turn feedback into products your users love
Centralize feedback, identify product opportunities, and build the right features
How to turn SaaS metrics into better decisions
A metric becomes useful when it changes what your team does next. Give each priority KPI an owner, a regular review schedule, and a clear action when results fall outside the expected range.
For example, falling GRR should trigger an investigation into the accounts and revenue you lost. Jumping straight to a new acquisition campaign leaves the retention problem unresolved.
Use a repeatable review process:
- Identify which customers are affected: Break the change down by plan, where customers came from, how they use the product, or when they joined. Check whether a few large accounts explain most of the change.
- Analyze customer feedback: Read cancellation reasons, support conversations, survey responses, and feature requests from that group. Distinguish a repeated problem from an isolated suggestion.
- Prioritize product improvements: Choose an onboarding fix, product improvement, or pricing experiment that addresses the evidence. Record which metric should move and why.
- Measure the result: Compare similar customer groups or run an experiment where practical. Give customers enough time to renew or complete the activation step before judging the outcome.
Featurebase connects feature requests with customer and revenue data, so you can see which companies want a feature and how much they currently spend with you.
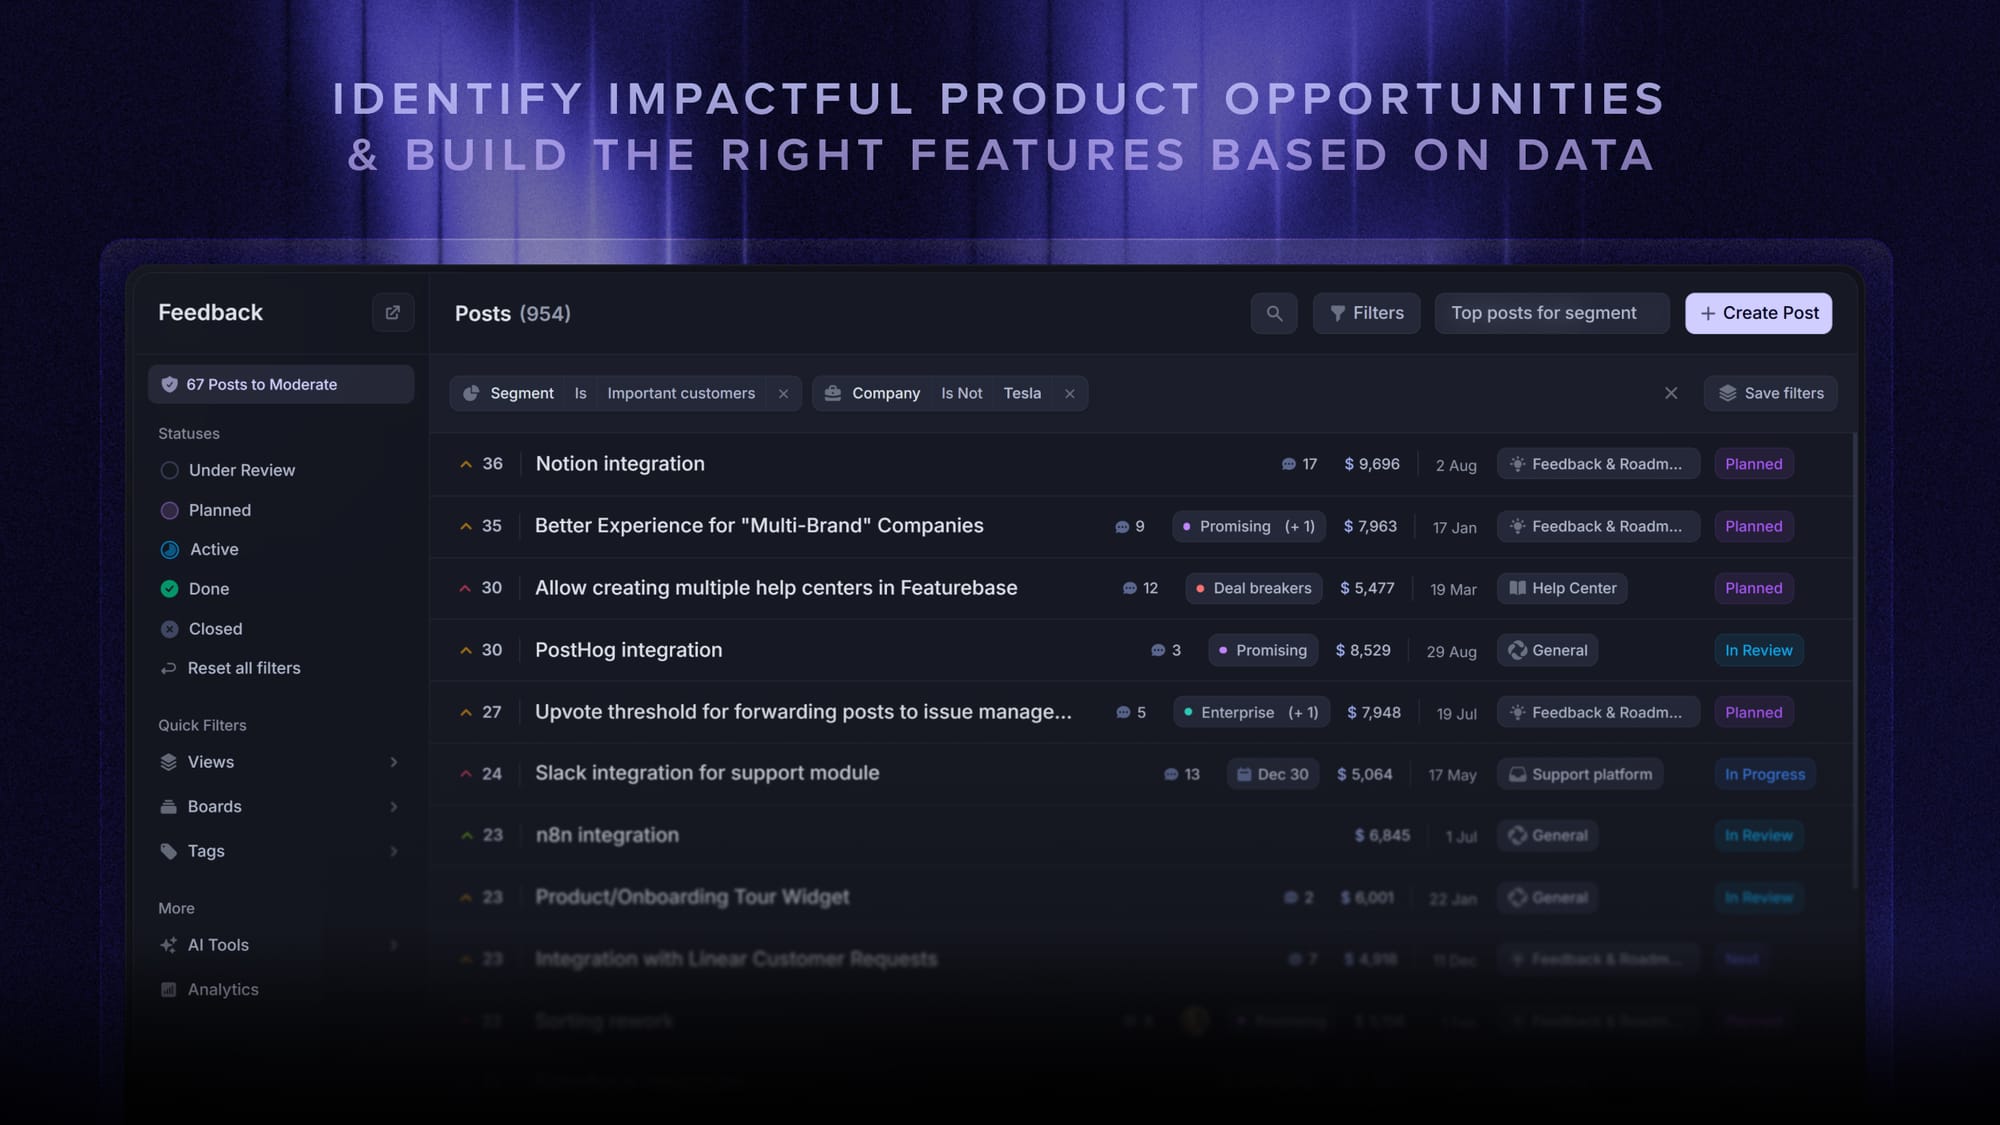
That revenue helps put the feedback in context. It doesn’t predict how much revenue building the feature will generate or retain, and the same customer’s spend can be associated with multiple feature requests.
After shipping, close the feedback loop by letting customers know what changed. Then check whether customers use the change and whether the metric you’re tracking improves.
Conclusion
Track B2B SaaS metrics together, calculate them consistently, and investigate the customers behind each change. That gives your team a clearer basis for deciding where to invest next.
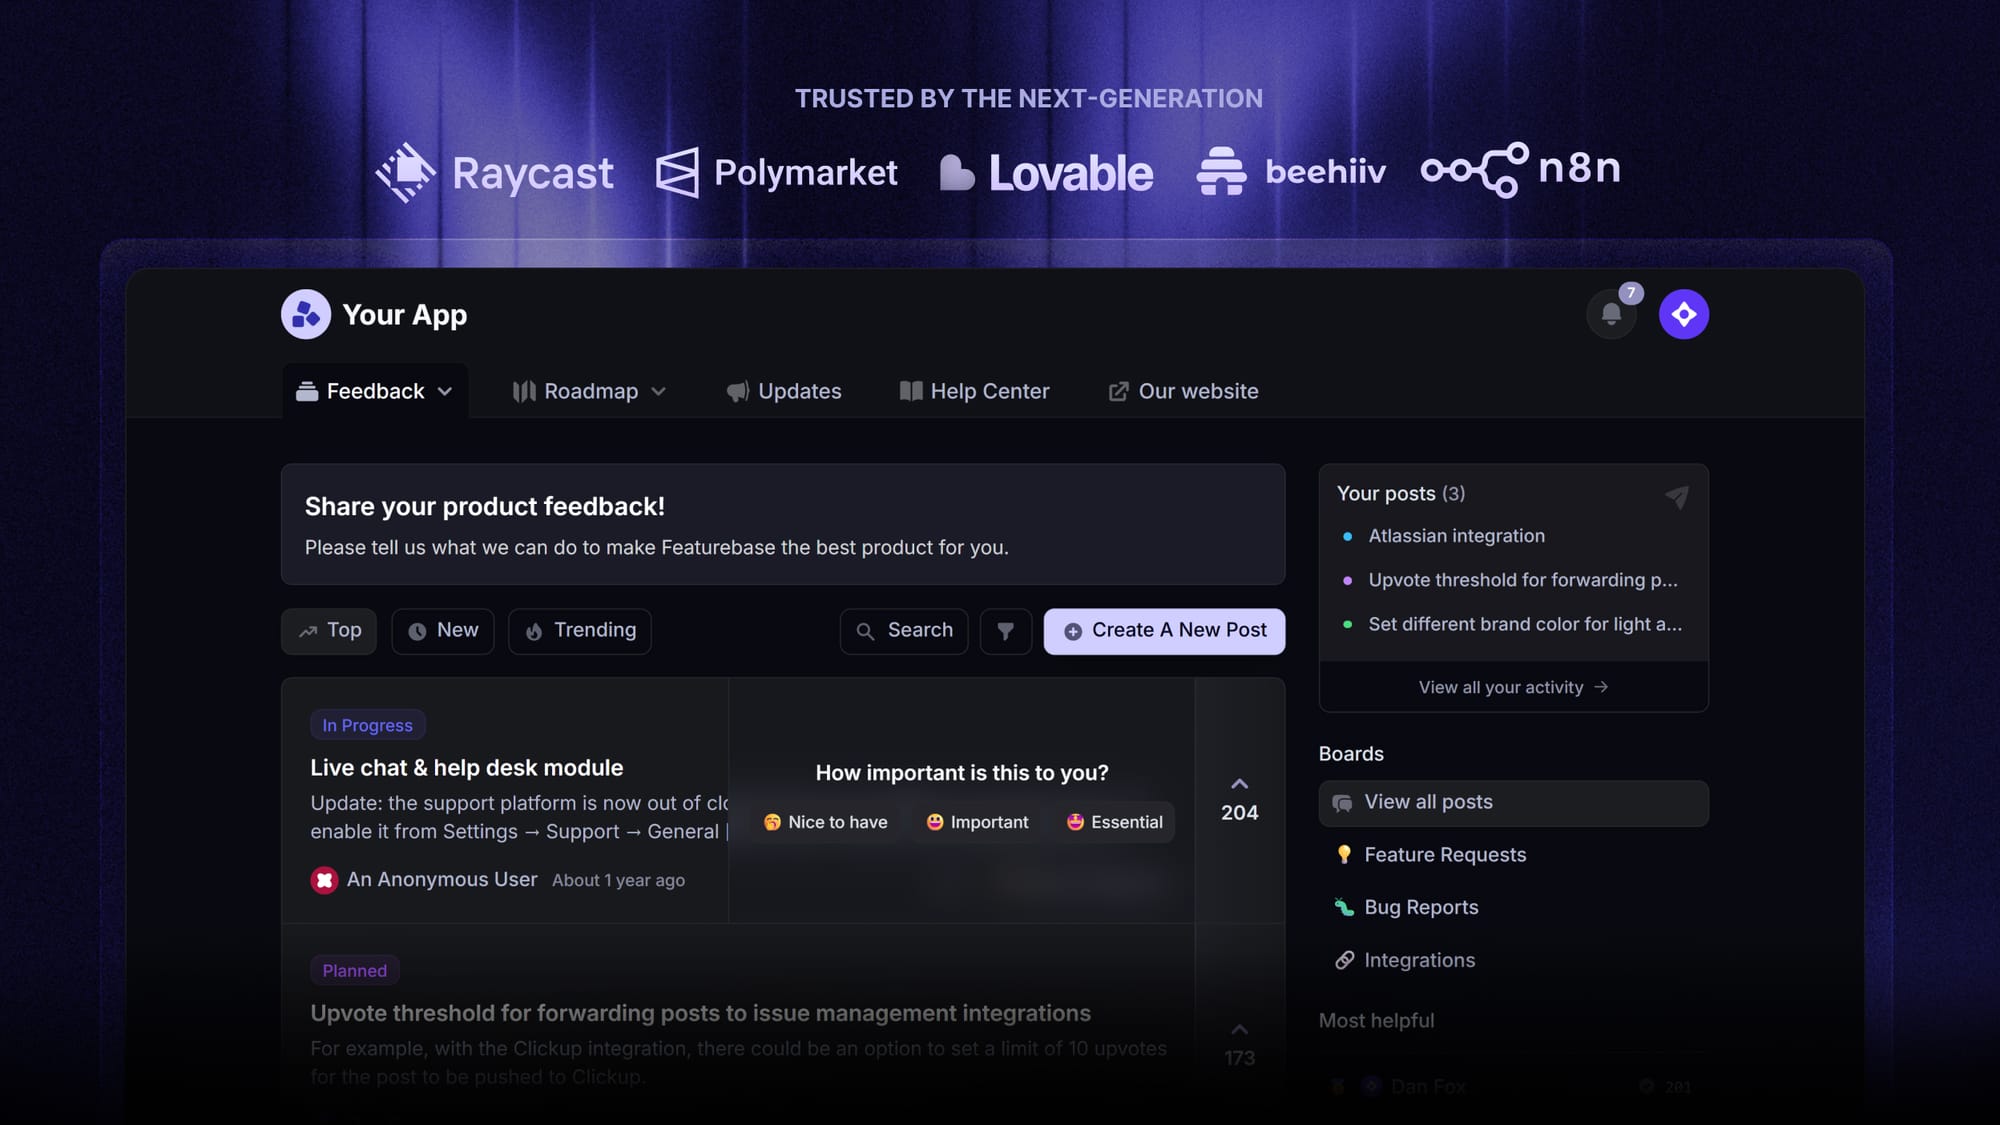
Featurebase is a modern & powerful feedback tool. It helps you collect feedback with a feature voting forum, surveys, embeddable widgets, and integrations. You can then analyze all of that feedback in one place by connecting it to your customers’ revenue and data to make better product decisions.
It comes with a Free plan, so you can start collecting feedback before committing to a paid plan. 👇
✨ Start collecting & managing feedback with Featurebase for free →
FAQs
Which B2B SaaS metrics matter most before product-market fit?
Start with activation, repeat use of your product’s main features, and retention by customer cohort, alongside cash runway. With few customers, a single cancellation can cause a large percentage change, so look at individual accounts and interview customers about the value they receive. Acquisition efficiency becomes easier to judge once you have a repeatable way to win customers and enough retention history.
What is the Rule of 40 in SaaS?
The Rule of 40 adds annual revenue growth and profit margin, often measured as free cash flow margin, with 40% used as a reference point. For example, 30% growth plus a 10% free cash flow margin gives a score of 40%. Use a consistent margin definition and treat it as a starting point for assessing growth and profitability, since Bessemer’s analysis explains why the combined score alone can’t capture a business’s quality.
What support metrics should a B2B SaaS company track?
Track support metrics such as first response time, resolution time, and customer satisfaction alongside the volume and reasons for incoming requests. Segment results by issue type and customer expectations so a complex technical case isn’t judged against a simple billing question. Pair speed with quality checks to avoid rewarding quick closures that leave customers’ problems unresolved.
How do annual upfront payments affect MRR and cash flow?
Annual upfront payments bring cash into the business sooner, but the recurring subscription value is still spread across the service period for MRR reporting. A customer who prepays a $12,000 annual contract gives you $12,000 in cash upfront while contributing $1,000 MRR. You have that cash available sooner, but you still need to cover the cost of serving the customer throughout the year.
Do you need a dedicated SaaS metrics dashboard?
A spreadsheet can work while you have a manageable number of accounts and reliable source data. A dedicated dashboard becomes more useful when checking and combining data by hand takes too much time. Bring together billing, finance, customer records, and product usage data, and document metric definitions before relying on automated reporting.