Deflection Rate: How to Calculate and Measure It
Learn how to calculate deflection rate with worked examples, consistent denominators, and clear time windows. Measure resolution alongside avoided handoffs.


On this page
- Key takeaways
- What is deflection rate?
- How to calculate deflection rate
- Deflection rate examples
- Deflection rate vs containment rate vs resolution rate
- How to measure deflection rate consistently
- What is a good deflection rate?
- Track deflection alongside customer outcomes
- Measure AI support outcomes with Featurebase
- Conclusion
Automate your support with the fastest AI-enhanced Inbox today
A high deflection rate can make your support dashboard look healthy while customers keep returning with the same unresolved questions. The calculation only helps when you know what went into it.
In this guide, I'll walk through the formula, worked examples, and measurement rules that help you distinguish fewer human handoffs from problems actually solved. 👇
Key takeaways
- Deflection rate measures the share of eligible support interactions that meet your definition of avoiding human assistance.
- Keep the denominator consistent: A chatbot-only rate and an overall support rate answer different questions.
- Track resolution separately: No handoff, no reply, and a closed conversation do not prove the customer's issue was solved.
- Compare like-for-like benchmarks: Match the channel, issue mix, outcome definition, and follow-up window before comparing percentages.
- ✨ Featurebase reports Fibi AI Agent deflection, resolution, and customer satisfaction separately, including assumed and confirmed resolutions.
What is deflection rate?
Deflection rate is the percentage of eligible support interactions that avoid human assistance under a defined counting rule. Those interactions might involve a help center, a chatbot, or an automated support workflow.
The important detail is what qualifies as deflected. A dashboard might count conversations that ended without an agent, while a stricter report requires evidence that customer self-service resolved the issue.
For example, a customer who downloads an invoice through self-service has completed a task. A customer who closes the chat after an unhelpful answer has only ended an interaction. Treating both as successful resolutions hides the difference.
How to calculate deflection rate
Use this basic deflection rate formula:
Deflection rate = (Qualifying deflected interactions ÷ Total eligible support interactions) × 100
Every interaction in the numerator must also belong to the denominator. Define both before pulling the numbers.
Define what counts as deflected
Separate the signals your reporting can actually observe:
- No human assistance: The interaction ended without an agent handling it. This measures observed deflection, including outcomes you may not have verified.
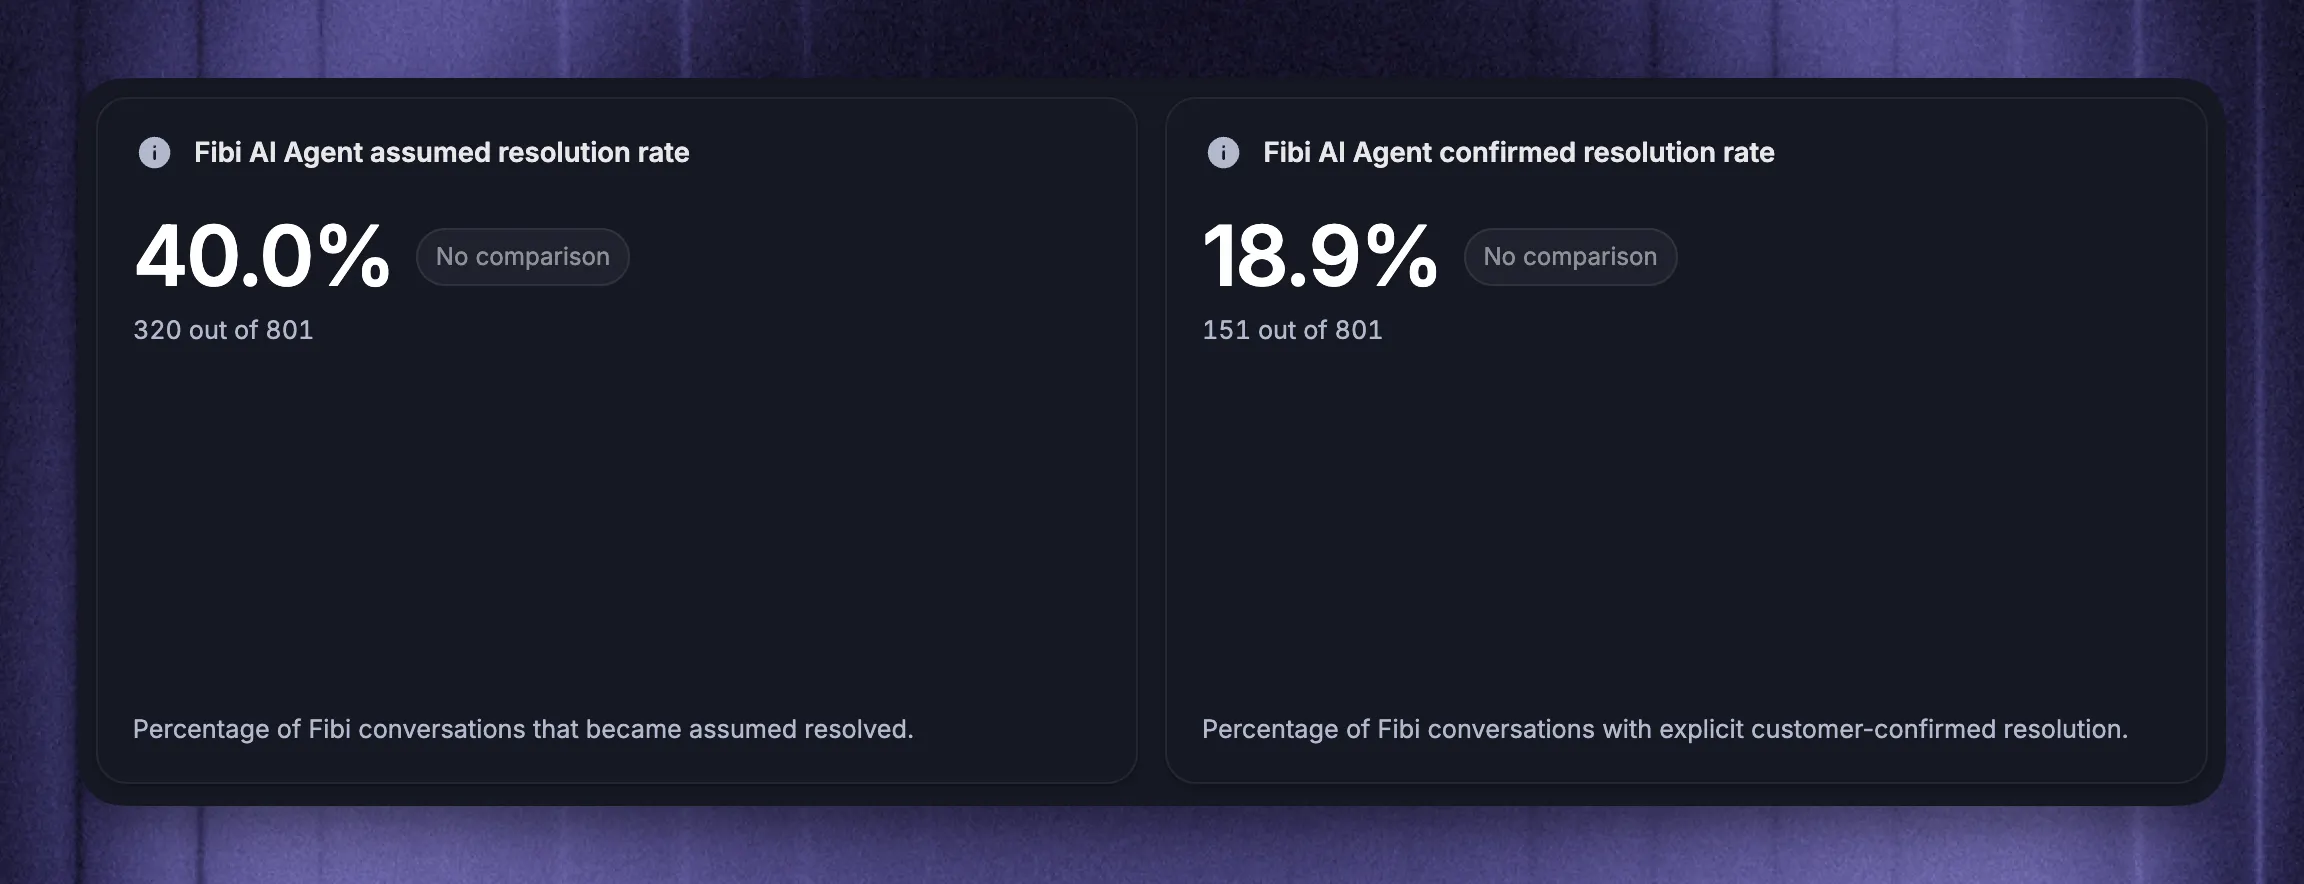
- Confirmed resolution: The customer confirmed the answer worked, or a relevant task-completion event provides evidence of success.
- Assumed resolution: The system inferred success, such as when a customer stopped responding after an answer.
Keep known abandonment and unknown outcomes visible. They should not become confirmed resolutions simply because nobody created a ticket.
Choose a consistent denominator
Choose the population that matches your question:
- All eligible support journeys: Use this to measure overall coverage.
- Chatbot-involved conversations: Use this to measure performance within the chatbot's workload.
- Help-center support sessions: Use this to evaluate that self-service channel.
A support journey means 1 customer's attempt to solve 1 issue. It can include several messages, sessions, or channels. Choose a unit you can track reliably and label it clearly.
Page views are a different unit. Dividing avoided tickets by article views mixes events that do not represent equivalent support requests.
Calculate the percentage
Divide the qualifying count by the eligible total and multiply by 100. If the denominator is zero, report the rate as unavailable.
Only use deflected ÷ (deflected + assisted) when those categories are mutually exclusive and account for the entire eligible population. Open, abandoned, or unclassified journeys may otherwise disappear from your calculation.
Deflection rate examples
The following numbers are hypothetical. They illustrate how reporting choices change the result, not what your team should expect to achieve.
1. Basic ticket deflection calculation
A team tracks 1,000 eligible support journeys. After its follow-up window closes, 600 have confirmed self-service resolution without human assistance and 400 required an agent.
Ticket deflection rate = (600 ÷ 1,000) × 100 = 60%
Here, the evidence supports describing those 600 journeys as successfully resolved through self-service.
Dividing 600 by the 400 assisted journeys gives 150%. That is a self-service-to-assisted ratio, not the percentage of all journeys deflected. A percentage whose numerator is a subset of its denominator cannot exceed 100%.
2. Chatbot-only versus overall deflection
In a separate example, another team records 1,000 support journeys. Each has 1 initial conversation:
| Initial route and outcome | Journeys |
|---|---|
| Chatbot, ended without human assistance | 500 |
| Chatbot, escalated to an agent | 300 |
| Went directly to an agent | 200 |
| Total | 1,000 |
The chatbot participated in 800 conversations, so:
Chatbot deflection rate = (500 ÷ 800) × 100 = 62.5%
Overall observed deflection rate = (500 ÷ 1,000) × 100 = 50%
Both calculations are valid under the stated no-human-assistance rule. The first describes performance within the chatbot's workload. The second describes coverage across all support journeys.
3. Adjusting for repeat contacts and unresolved outcomes
Continue example 2 and observe each journey for 7 days after its initial conversation ends. During that period, 50 of the 500 initially deflected journeys require human help for the same issue.
Keep the original denominator of 1,000 journeys. Those follow-up contacts belong to existing journeys:
Observed deflection after follow-up = (450 ÷ 1,000) × 100 = 45%
Of the remaining 450, suppose 350 have explicit customer confirmation and 100 have no confirmation or task-completion evidence.
The confirmed self-service resolution share is 35% of all journeys. Another 10% ended without human help but remain unverified. Unknown does not automatically mean failed, but it does not establish success either.
The 7-day window is an illustrative choice. Use a window appropriate to your customers' behavior and keep it consistent.
Deflection rate vs containment rate vs resolution rate
These metrics can overlap, but the labels do not guarantee the same calculation. Check the reporting definition behind each one.
| Metric | What it measures | Denominator to specify | Main limitation |
|---|---|---|---|
| Deflection rate | Interactions meeting a defined rule for avoiding human assistance | All eligible journeys or a named self-service population | Avoiding an agent does not prove resolution |
| Chatbot containment rate | Eligible bot conversations ending without escalation | Eligible chatbot conversations | A contained conversation can still be abandoned or unresolved |
| Resolution rate | Interactions meeting a defined resolution criterion | All eligible interactions or a named subset, such as AI-involved conversations | A resolved status may include inferred success |
Chatbot deflection and containment can be numerically identical when both count the same conversations ending without human involvement. Deflection can also cover broader self-service activity outside the chatbot.
Resolution adds an outcome criterion, but inspect that criterion too. Customer confirmation, a completed account action, and an inactivity timeout provide different levels of evidence.
How to measure deflection rate consistently
A repeatable report needs a written measurement definition. These 5 rules make it easier to compare results over time.
1. Define eligibility before counting outcomes
Document the included channels, issue types, and customer population. Exclude spam and internal tests consistently from both counts.
Do not remove difficult cases from the denominator after they escalate. If you measure only requests eligible for automation, label the result as an eligible-request rate and report how much total demand that population represents.
2. Use the same cohort and timestamps
For a journey-based report, group journeys by when they start and follow that same group through the outcome window. Avoid dividing resolutions recorded this month by unrelated requests created this month.
Record the timezone and the reporting cutoff. Vendor dashboards may use different event timestamps, so check their definitions before reconciling totals.
3. Let the follow-up window finish
If your rule observes customers for 7 days after the initial conversation ends, a conversation ending on September 30 needs observation through October 7. An initial conversation still open needs more time.
Mark unfinished results as provisional and show pending counts. A short inactivity timeout and a same-issue follow-up window serve different purposes.
4. Connect repeat contacts across channels
Match customer identity and issue context across chat, email, and other support channels. A chatbot conversation followed by an email about the same problem belongs to the same journey.
For anonymous or unmatched sessions, disclose the tracking gap. Missing visibility is not evidence that a customer never returned.
Featurebase's Fibi reporting measures deflection per conversation. Human involvement after reopening changes that conversation's classification, while a new conversation is counted separately. A journey-based repeat-contact report therefore needs an additional matching step.
5. Report uncertainty and attribution limits
Keep confirmed outcomes, inferred outcomes, and unknown outcomes distinguishable. Review a sample of conversations against customer feedback or task-completion evidence.
A visit to a self-service knowledge base without a ticket does not prove that the visitor would otherwise have contacted support. Likewise, a lower ticket count after launching AI can reflect seasonality, customer growth, or product changes. A comparable control group or carefully designed experiment provides stronger evidence of incremental impact.
What is a good deflection rate?
A useful target starts with your own baseline and customer outcomes. Compare similar issue categories over time, then check whether apparent gains hold after repeat contacts and unresolved cases are accounted for.
Routine invoice requests and complex integration failures should not share an assumed ceiling. A change in the mix of requests can move the overall percentage even when performance within each category stays unchanged.
How to evaluate an AI ticket deflection rate benchmark
Before using a published benchmark to set a target, check:
- Population: Does it cover all support demand, only AI-involved conversations, or selected automation-eligible requests?
- Outcome rule: Does success mean no handoff, customer confirmation, task completion, or an assumed resolution?
- Time window: How are delayed escalations and repeat contacts handled?
- Sample and method: Is it 1 selected customer or a broader sample? Is the headline an average across companies or a rate weighted by conversation volume?
- Context: Are the channels, issue complexity, languages, and deployment maturity comparable to yours?
For context, Gartner reported that 14% of customer service issues were fully resolved in self-service, based on a December 2023 survey of 5,728 customers published in August 2024. That is historical self-service resolution research, not a current AI ticket deflection benchmark.
Without matching definitions, a published percentage cannot tell you whether your own deployment is performing well. Show the underlying counts, too, so readers can judge how much evidence supports each rate.
Track deflection alongside customer outcomes
Use companion customer service metrics to understand what happens behind the headline percentage:
- Resolution evidence: Separate customer-confirmed or task-verified outcomes from assumed resolutions.
- Repeat contact rate: Track the share of initially deflected journeys that return about the same issue within your chosen window.
- Customer satisfaction: Review CSAT for automated support separately, alongside the number of responses and response rate. Respondents may not represent everyone who used the service.
- Escalation quality: Check whether customers reach a person when needed and whether the agent receives enough context to continue.
Use those findings to prioritize changes. If resolution evidence weakens or same-issue returns increase, investigate before celebrating a higher deflection rate.
For implementation tactics, our guide to reducing support tickets covers product fixes, better self-service, and support automation.
Measure AI support outcomes with Featurebase
Featurebase is a modern AI customer support platform for product-led SaaS. It combines AI-powered support, help center, and feedback management into a single platform for startups that want all their customer-facing tools in one place. Featurebase is loved by thousands of support teams from companies like Lovable, Raycast, and n8n. 💫
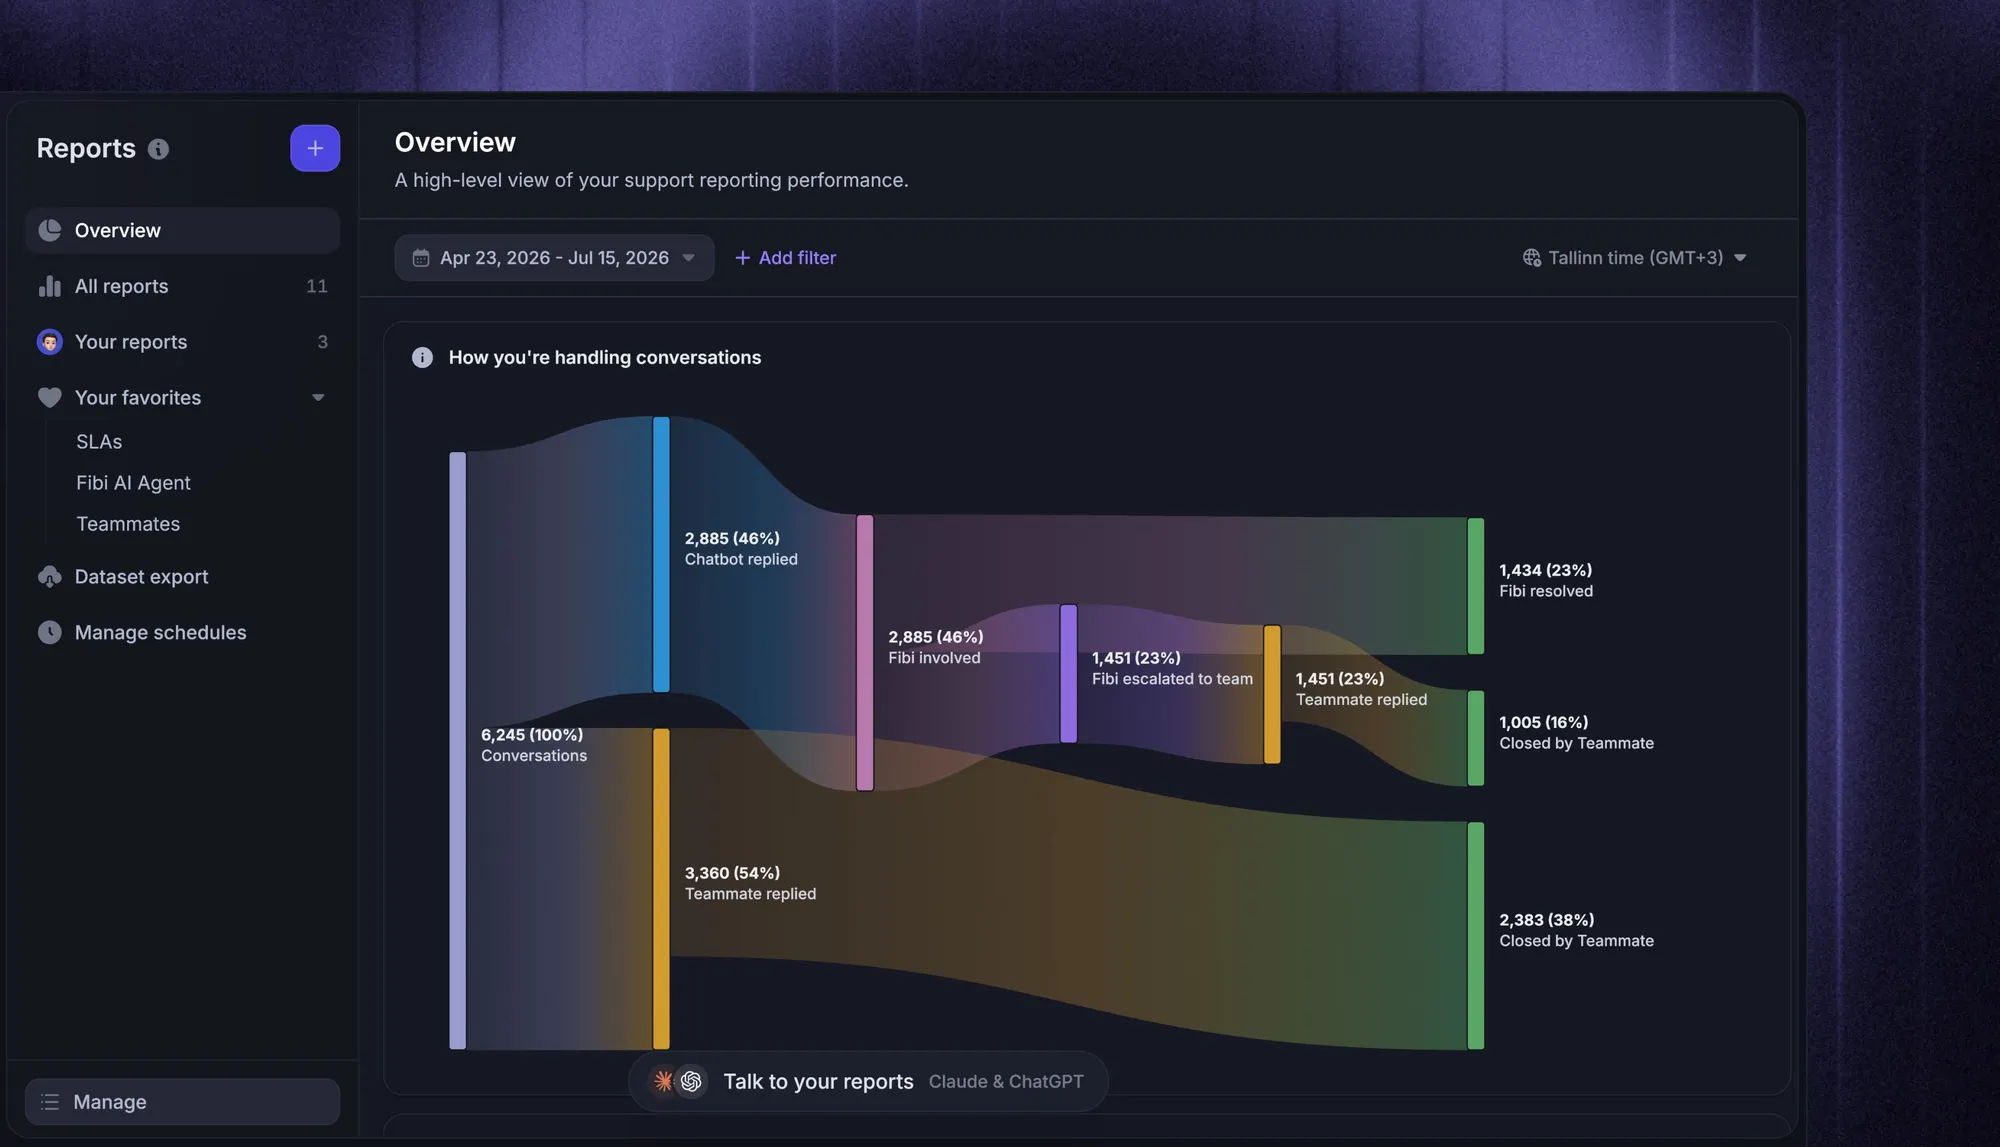
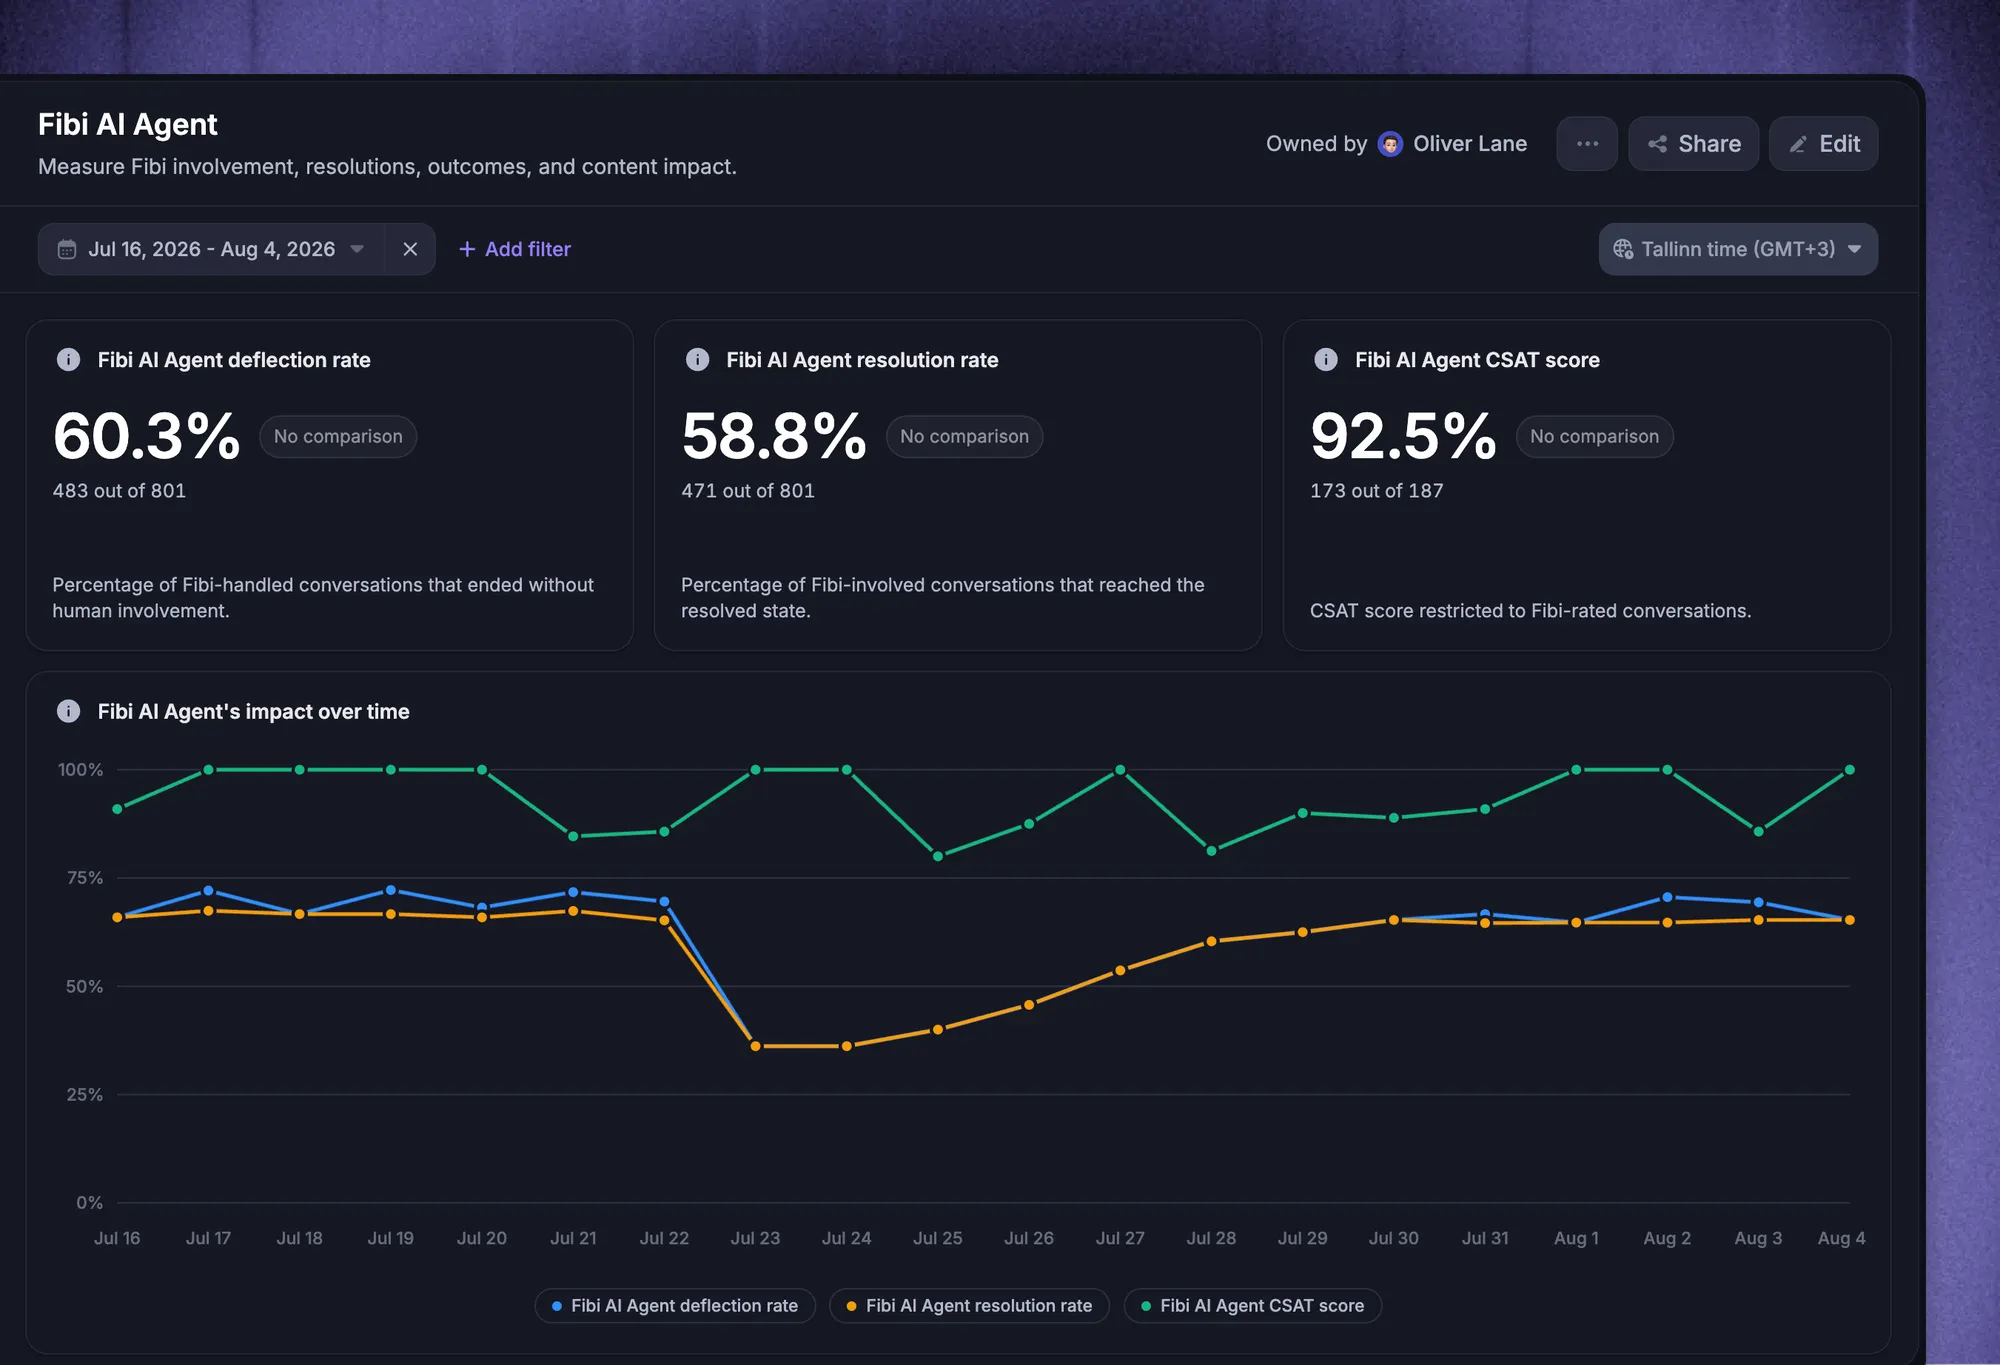
Fibi AI Agent reporting brings deflection, resolution, handoffs, and CSAT together. It also separates assumed and customer-confirmed resolutions, so you can inspect how much of the resolution figure relies on inference.
Top features:
- Omnichannel inbox – Manage live chat, email, and Slack conversations from one AI-powered view
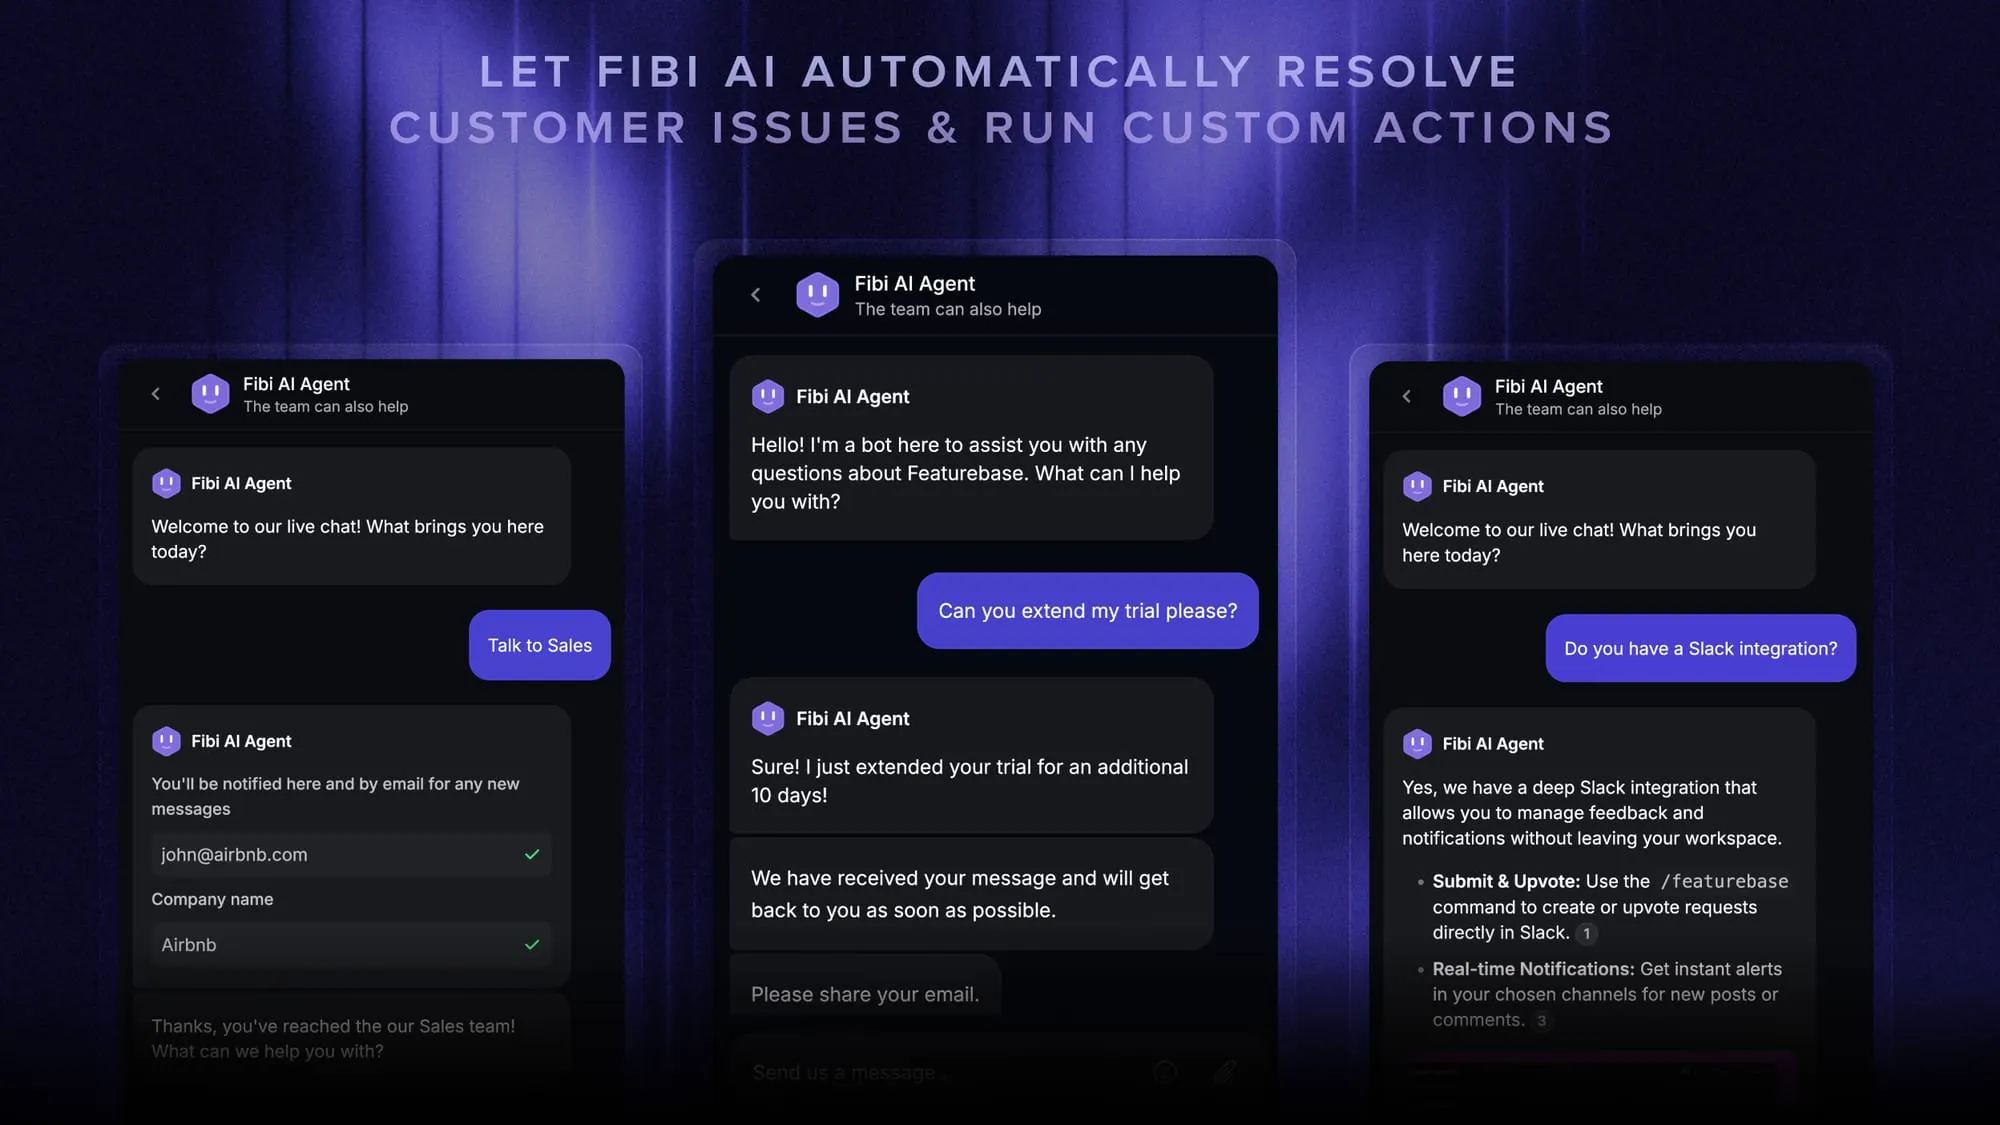
- Fibi AI Agent - Resolve customer issues on autopilot & run custom actions like trial extensions and refunds
- Help center with AI search – Provide instant, multilingual self-serve answers
- Workflows & automations – Auto-assign tickets, route conversations, collect customer data, and more
- AI Copilot – Help your agents answer customers faster with AI Copilot that uses your internal knowledge
- Multi-brand support – Manage multiple Help Centers and Live chats from a single workspace
- Automatic AI translations – Automatically translate all messages and help articles to your customers native language
- Service Level Agreements – Track SLAs to make sure your team responds to customers on time, every time
- Mobile app – Respond to customers, receive notifications, and unblock users on the go
- Feedback & roadmap tools – Collect feature requests and close the loop with updates
- Product updates – Publish release notes with a changelog page, in-app widget, and emails
- Integrations – Connects with Slack, Linear, Jira, HubSpot, and more
Pricing: Free plan available with unlimited conversations. Paid plans start at $29/seat/month, billed yearly, with $0.49 per AI resolution. Fibi and reporting require a paid plan, and feature availability varies by plan.
Featurebase covers all the basic support features that legacy platforms do, but with a much more modern approach. It comes with AI automations, a mobile app, and multiple channels (email, live chat, Slack, etc.).
Conclusion
Deflection rate becomes useful when the counting rules stay consistent. Define the eligible population, wait for outcomes to mature, and report resolution evidence alongside avoided human assistance.
Featurebase combines Fibi AI Agent, a help center, and an omnichannel inbox with reporting that separates deflection from resolution. That helps your team review automation alongside the customer outcomes it is meant to improve.
It comes with a Free plan with unlimited conversations, and you can try the paid features with a 10-day free trial. There's no downside to trying it. 👇
Automate your support with the fastest AI-enhanced Inbox today
FAQs
Yes. If requests rise from 1,000 to 2,000 while deflection improves from 50% to 60%, assisted requests still increase from 500 to 800. Report absolute assisted volume and contacts per active customer alongside the percentage.
No. AI usage, software subscriptions, content maintenance, and quality review all contribute to cost. Time saved creates capacity, while actual financial savings depend on how that capacity affects spending.
A weekly review can help identify operational changes, while a monthly review can support trend reporting. Match the cadence to your support volume and allow enough time for outcomes to mature before comparing finalized results.
An agent reply drafted with AI still involves human support, so exclude it from a no-human-assistance numerator. Track its benefit through handling time or agent productivity instead of combining it with autonomous resolutions.
Compare the old and new metric definitions before joining their historical trends. Where possible, calculate both definitions on the same exported sample and document the differences. Mark a break in the series when the underlying data cannot support a fair comparison.